
Page 50 - Application Notebook - Solution for Food Safety
P. 50
LAAN-A-LM-E074
Application Liquid Chromatography Mass Spectrometry
News Analysis of Nivalenol, Deoxynivalenol, 3-Acetyldeoxynivalenol
and 15-Acetyldeoxynivalenol Using Triple Quadrupole
No.C103 LC/MS/MS (LCMS-8050)
Nivalenol and deoxynivalenol are mycotoxins which are 0717001 issued by the Dept. of Food Safety, Pharmaceutical
produced by the fusarium fungi. A provisional reference and Food Safety Bureau, Japanese Ministry of Health, Labour
value of 1.1 ppm was established in Japan for deoxynivalenol and Welfare on July 17, 2003).
(Notification No. 0521001 issued by the Pharmaceutical and This paper describes an LC-MS/MS method for high-
Food Safety Bureau, Japanese Ministry of Health, Labour and sensitivity simultaneous analysis of the four compounds,
Welfare on May 21, 2002). The test methods specified for nivalenol, deoxynivalenol and the deoxynivalenol
deoxynivalenol are HPLC for both qualitative and quantitative metabolytes, 3-acetyl-deoxynivalenol and 15-acetyl-
analysis, and LC/MS for verification testing (Notification No. deoxynivalenol.
n Analysis of a Standard Mixture
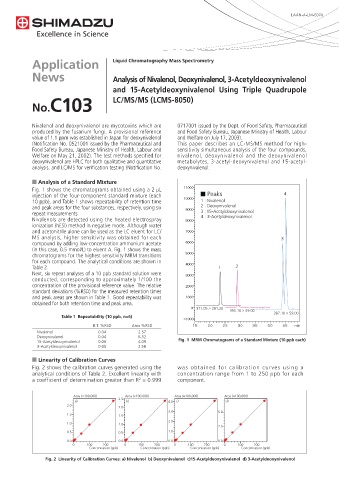
Fig. 1 shows the chromatograms obtained using a 2 µL
injection of the four-component standard mixture (each Peaks 4
10 ppb), and Table 1 shows repeatability of retention time 1 : Nivalenol
and peak areas for the four substances, respectively, using six 2 : Deoxynivalenol
repeat measurements. 3 : 15-Acetyldeoxynivalenol
Nivalenols are detected using the heated electrospray 4 : 3-Acetyldeoxynivalenol
ionization (hESI) method in negative mode. Although water
and acetonitrile alone can be used as the LC eluent for LC/
MS analysis, higher sensitivity was obtained for each 3
compound by adding low-concentration ammonium acetate
(in this case, 0.5 mmol/L) to eluent A. Fig. 1 shows the mass
chromatograms for the highest sensitivity MRM transitions
for each compound. The analytical conditions are shown in
Table 2. 1 2
Next, six repeat analyses of a 10 ppb standard solution were
conducted, corresponding to approximately 1/100 the
concentration of the provisional reference value. The relative
standard deviations (%RSD) for the measured retention times
and peak areas are shown in Table 1. Good repeatability was
obtained for both retention time and peak area.
371.05 > 281.20
355.10 > 59.00 397.10 > 59.00
Table 1 Repeatability (10 ppb, n=6)
R.T. %RSD Area %RSD
Nivalenol 0.04 2.57
Deoxynivalenol 0.04 6.52
15-Acetyldeoxynivalenol 0.06 4.09 Fig. 1 MRM Chromatograms of a Standard Mixture (10 ppb each)
3-Acetyldeoxynivalenol 0.05 2.58
n Linearity of Calibration Curves
Fig. 2 shows the calibration curves generated using the was obtained for calibration curves using a
analytical conditions of Table 2. Excellent linearity with concentration range from 1 to 250 ppb for each
a coefficient of determination greater than R = 0.999 component.
2
Area (×100,000) Area (×100,000) Area (×100,000) Area (×100,000)
2.5
a) b) 4.0 c) d)
2.0
2.0
3.0 5.0
1.5 1.5
2.0
1.0 1.0
2.5
0.5 0.5 1.0
0.0 0.0 0.0 0.0
0 100 200 0 100 200 0 100 200 0 100 200
Concentration (ppb) Concentration (ppb) Concentration (ppb) Concentration (ppb)
Fig. 2 Linearity of Calibration Curves: a) Nivalenol b) Deoxynivalenol c)15-Acetyldeoxynivalenol d) 3-Acetyldeoxynivalenol