
Page 49 - Application Notebook - Solution for Food Safety
P. 49
Application No. C161
News
Quantitation Results using MRM Spectrum Mode
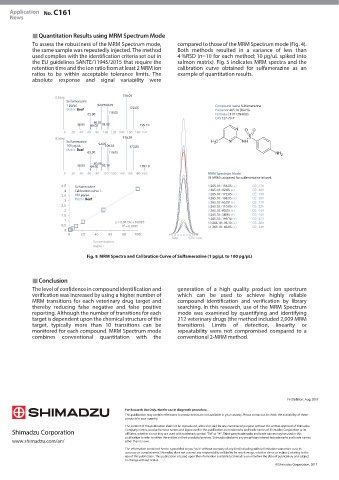
To assess the robustness of the MRM Spectrum mode, compared to those of the MRM Spectrum mode (Fig. 4).
the same sample was repeatedly injected. The method Both methods resulted in a variance of less than
used complies with the identification criteria set out in 4 %RSD (n=10 for each method; 10 pg/uL spiked into
the EU guidelines SANTE/11945/2015 that require the salmon matrix). Fig. 5 indicates MRM spectra and the
retention time and the ion ratio from at least 2 MRM ion calibration curve obtained for sulfamerazine as an
ratios to be within acceptable tolerance limits. The example of quantitation results.
absolute response and signal variability were
156.05
8.89e5
Sulfamerazine
1 pg/μL 92.05108.05 Compound name Sulfamerazine
Matrix Beef 172.05 Precursor 265.10 [M+H]+
110.05
65.00 Formula C11H12N4O2S
CAS 127-79-7
80.05
38.95 66.05 93.10 199.10
N O O
0 20 40 60 80 100 120 140 160 180 m/z
8.49e6 156.05 S
Sulfamerazine H 3 C N NH
100 pg/μL 92.05 108.05 172.05
Matrix Beef
65.00 110.05 NH 2
80.05
38.95 66.05 93.10 199.10
0 20 40 60 80 100 120 140 160 180 m/z MRM Spectrum Mode
11 MRM’s acquired for sulfamerazine in beef.
4.5 Sulfamerazine 1:265.10>156.05 (+) CE: -17V
4 Calibration curve 1- 2:265.10>92.05 (+) CE: -30V
3.5 100 pg/μL 3:265.10>172.05 (+) CE: -15V
3 Matrix Beef 4:265.10>108.05 (+) CE: -26V
5:265.10>65.00 (+)
CE: -11V
2.5 6:265.10>110.05 (+) CE: -22V
2 7:265.10>80.05 (+) CE: -15V
1.5 8:265.10>38.95 (+) CE: -14V
1 y = 0.0419x + 0.0085 9:265.10>199.10 (+) CE: -21V
0.5 R² = 0.9997 10:265.10>93.10 (+) CE: -30V
CE: -24V
11:265.10>66.05 (+)
0
0 20 40 60 80 100
5.60 5.70 min
Concentration
(pg/uL)
MRM Spectra and Calibration Curve of Sulfamerazine (1 pg/μL to 100 pg/μL)
Conclusion
The level of confidence in compound identification and generation of a high quality product ion spectrum
verification was increased by using a higher number of which can be used to achieve highly reliable
MRM transitions for each veterinary drug target and compound identification and verification by library
thereby reducing false negative and false positive searching. In this research, use of the MRM Spectrum
reporting. Although the number of transitions for each mode was examined by quantifying and identifying
target is dependent upon the chemical structure of the 212 veterinary drugs (the method included 2,009 MRM
target, typically more than 10 transitions can be transitions). Limits of detection, linearity or
monitored for each compound. MRM Spectrum mode repeatability were not compromised compared to a
combines conventional quantitation with the conventional 2-MRM method.
First Edition: Aug. 2017
For Research Use Only. Not for use in diagnostic procedure.
This publication may contain references to products that are not available in your country. Please contact us to check the availability of these
products in your country.
The content of this publication shall not be reproduced, altered or sold for any commercial purpose without the written approval of Shimadzu.
Company names, product/service names and logos used in this publication are trademarks and trade names of Shimadzu Corporation or its
affiliates, whether or not they are used with trademark symbol “TM” or “£”. Third-party trademarks and trade names may be used in this
publication to refer to either the entities or their products/services. Shimadzu disclaims any proprietary interest in trademarks and trade names
www.shimadzu.com/an/ other than its own.
The information contained herein is provided to you "as is" without warranty of any kind including without limitation warranties as to its
accuracy or completeness. Shimadzu does not assume any responsibility or liability for any damage, whether direct or indirect, relating to the
use of this publication. This publication is based upon the information available to Shimadzu on or before the date of publication, and subject
to change without notice.
© Shimadzu Corporation, 2017