
Page 19 - Application Notebook - Solution for Food Development
P. 19
Application No.L463
News
n Repeatability mV
Table 2 and 3 show the relative standard deviations (n=6) 1000
of retention time and peak area obtained in repeat analysis 1 ■ Peaks
of a mixed histamine and tyramine standard solution (each 1. Histamine
1 mg/L). Limits for histamine differ depending on the 750 2. Tyramine
country, but in Codex, for example, the limit associated
with decomposition in fish and fishery products is 500
100 mg/kg. Good repeatability has been obtained at a
concentration of about 1/100 of the criterion. 2
250
Table 2 Repeatability of Peak Table 3 Repeatability of Peak
Area and Retention Area and Retention
Time of Histamine Time of Tyramine 0
0 5 10 15 min
R.t (min) Peak Area R.t (min) Peak Area
1st 9.962 433,724 1st 11.844 153,458 Fig. 5 Chromatogram of Red Wine
2nd 9.983 431,874 2nd 11.871 155,582
3rd 9.967 441,528 3rd 11.858 155,848 mV
4th 9.962 429,887 4th 11.855 154,509 1000
5th 9.972 439,560 5th 11.882 151,206 ■Peaks
6th 9.993 434,818 6th 11.911 153,960 1 1. Histamine
Ave 9.973 435,232 Ave 11.87 154,094 750 2. Tyramine
%RSD 0.12 1.03 %RSD 0.20 1.09
500
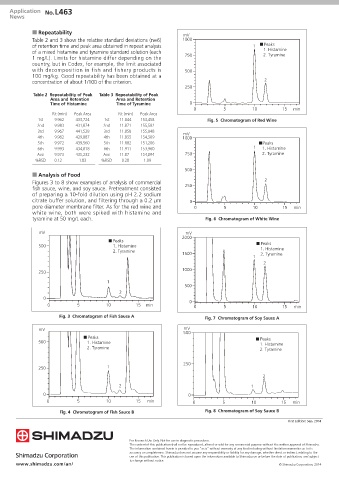
n Analysis of Food
Figures 3 to 8 show examples of analysis of commercial 2
fish sauce, wine, and soy sauce. Pretreatment consisted 250
of preparing a 10-fold dilution using pH 2.2 sodium
citrate buffer solution, and filtering through a 0.2 µm 0
pore diameter membrane filter. As for the red wine and 0 5 10 15 min
white wine, both were spiked with histamine and
tyramine at 50 mg/L each. Fig. 6 Chromatogram of White Wine
mV mV
2000
■ Peaks
500 1. Histamine ■ Peaks
2. Tyramine 1. Histamine
1500 2. Tyramine
1
2
1000
250
1
500
2
0
0 5 10 15 min 0 0 5 10 15 min
Fig. 3 Chromatogram of Fish Sauce A Fig. 7 Chromatogram of Soy Sauce A
mV mV
500
■ Peaks ■ Peaks
500 1. Histamine 1. Histamine
2. Tyramine 2. Tyramine
250
250 1
2
2 1
0 0
0 5 10 15 min 0 5 10 15 min
Fig. 4 Chromatogram of Fish Sauce B Fig. 8 Chromatogram of Soy Sauce B
First Edition: Sep. 2014
For Research Use Only. Not for use in diagnostic procedures.
The content of this publication shall not be reproduced, altered or sold for any commercial purpose without the written approval of Shimadzu.
The information contained herein is provided to you "as is" without warranty of any kind including without limitation warranties as to its
accuracy or completeness. Shimadzu does not assume any responsibility or liability for any damage, whether direct or indirect, relating to the
use of this publication. This publication is based upon the information available to Shimadzu on or before the date of publication, and subject
to change without notice.
www.shimadzu.com/an/ © Shimadzu Corporation, 2014