
Page 21 - LC-SFC_Pharma_Brochure
P. 21
5. Multi-Data Reports
4. Optimizing Gradient Conditions
4. Optimizing Gradient Conditions 5. Multi-Data Reports
After determining the optimal combination of mobile phases and In addition to normal analytical results reports, the multi-data report
column, method scouting can also involve optimizing gradient con- function in LabSolutions can also be used to prepare regulatory test-
ditions for the purpose of improving resolution or increasing speed. ing reports using MS Excel-like operability, such as for content unifor-
This section describes an example of using the mobile phases and mity tests and related substance tests. The window for creating
column determined in section 3 to optimize gradient conditions. multi-data report templates and the corresponding report output are
shown in Figure 15. The template creation window is conÿgured simi-
Multiple gradient conditions can be created easily by selecting
'custom' as the gradient mode in the main Method Scouting Solu- lar to spreadsheet software, with the ability to perform various calcu-
lations by entering or specifying various formulas or functions in re-
tion window. In the window shown in Figure 13, specify the initial
concentration, ÿnal concentration, washing concentration, and time spective cells. Field (1) in Figure 15 is for entering a function that ranks
the data obtained. The retention time, area, theoretical plates, resolu-
program settings. In addition, multiple concentration patterns can
be speciÿed for the initial and ÿnal concentration settings. In this ex- tion, and other chromatogram data can be conÿgured in the desired
layout by selecting them on the left side of the window, as shown in
ample, the initial concentration was set to 5, 10, and 15 % and the
ÿnal concentration was set to 29, 32, 35, and 38 %. Using all of (2) of Figure 15, and dragging them to the desired cell. Frequently
used functions, such as statistical functions or character string func-
these patterns for analysis results in 12 gradient condition conÿgura-
tions. Evaluation results obtained using these 12 gradient condition tions, can also be selected on the left side of the window to avoid the
trouble of having to enter the functions directly. Reports can be
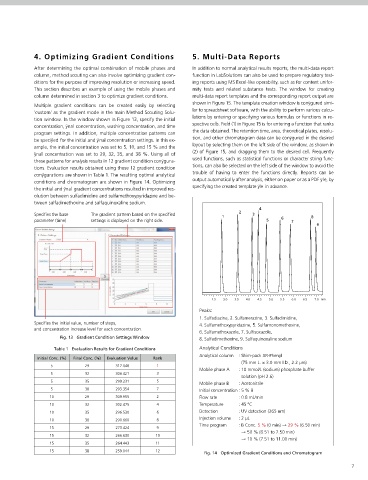
conÿgurations are shown in Table 1. The resulting optimal analytical
conditions and chromatogram are shown in Figure 14. Optimizing output automatically after analysis, either on paper or as a PDF ÿle, by
specifying the created template ÿle in advance.
the initial and ÿnal gradient concentrations resulted in improved res-
olution between sulfadimidine and sulfamethoxypyridazine and be-
tween sulfadimethoxine and sulfaquinoxaline sodium.
4
Specifies the base The gradient pattern based on the specified 1 2 3 8
parameter (time) settings is displayed on the right side. 5 6 7
9
2. 5 3 .0 3. 5 4 .0 4. 5 5 .0 5. 5 6 .0 6. 5 7 .0 min
Peaks:
1. Sulfadiazine, 2. Sulfamerazine, 3. Sulfadimidine,
Specifies the initial value, number of steps, 4. Sulfamethoxypyridazine, 5. Sulfamonomethoxine,
and concentration increase level for each concentration.
6. Sulfamethoxazole, 7. Sulfisoxazole,
Fig. 13 Gradient Condition Settings Window 8. Sulfadimethoxine, 9. Sulfaquinoxaline sodium
Table 1 Evaluation Results for Gradient Conditions Analytical Conditions
Analytical column : Shim-pack XR-Phenyl
Initial Conc. (%) Final Conc. (%) Evaluation Value Rank
(75 mm L. × 3.0 mm I.D., 2.2 µm)
5 29 317.048 1
Mobile phase A : 10 mmol/L (sodium) phosphate buffer
5 32 306.421 3
solution (pH 2.6)
5 35 299.231 5 Mobile phase B : Acetonitrile
5 38 293.354 7 Initial concentration : 5 % B
10 29 309.955 2 Flow rate : 0.8 mL/min
10 32 302.475 4 Temperature : 45 ºC
10 35 296.530 6 Detection : UV detection (265 nm)
Injection volume : 2 µL
10 38 290.660 8
Time program : B Conc. 5 % (0 min) ĺ 29 % (6.50 min)
15 29 273.424 9
ĺ 50 % (6.51 to 7.50 min)
15 32 266.630 10
ĺ 10 % (7.51 to 11.00 min)
15 35 264.443 11
15 38 259.044 12 Fig. 14 Optimized Gradient Conditions and Chromatogram
7