
Page 19 - LC-SFC_Pharma_Brochure
P. 19
3. Screening Mobile Phases and Columns Using the Multi-Data Report and
Browser Functions
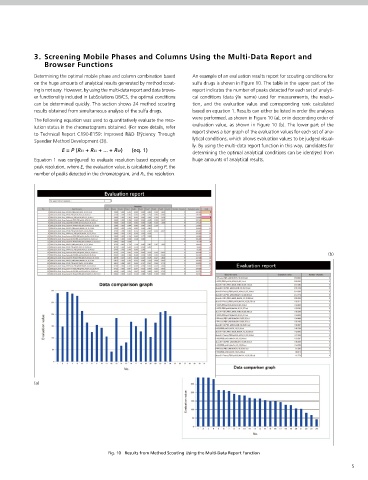
Determining the optimal mobile phase and column combination based An example of an evaluation results report for scouting conditions for
on the huge amounts of analytical results generated by method scout- sulfa drugs is shown in Figure 10. The table in the upper part of the
ing is not easy. However, by using the multi-data report and data brows- report indicates the number of peaks detected for each set of analyti-
er functionality included in LabSolutions DB/CS, the optimal conditions cal conditions (data ÿle name) used for measurements, the resolu-
can be determined quickly. This section shows 24 method scouting tion, and the evaluation value and corresponding rank calculated
results obtained from simultaneous analysis of the sulfa drugs. based on equation 1. Results can either be listed in order the analyses
were performed, as shown in Figure 10 (a), or in descending order of
The following equation was used to quantitatively evaluate the reso-
evaluation value, as shown in Figure 10 (b). The lower part of the
lution status in the chromatograms obtained. (For more details, refer
to Technical Report C190-E159: Improved R&D Efÿciency Through report shows a bar graph of the evaluation values for each set of ana-
lytical conditions, which allows evaluation values to be judged visual-
Speedier Method Development (3)).
ly. By using the multi-data report function in this way, candidates for
E = P (RS1 + RS2 + ... + RSP) (eq. 1)
determining the optimal analytical conditions can be identiÿed from
Equation 1 was conÿgured to evaluate resolution based especially on huge amounts of analytical results.
peak resolution, where E, the evaluation value, is calculated using P, the
number of peaks detected in the chromatogram, and RS, the resolution.
(b)
(a)
Fig. 10 Results from Method Scouting Using the Multi-Data Report Function
5