
Page 20 - LC-SFC_Pharma_Brochure
P. 20
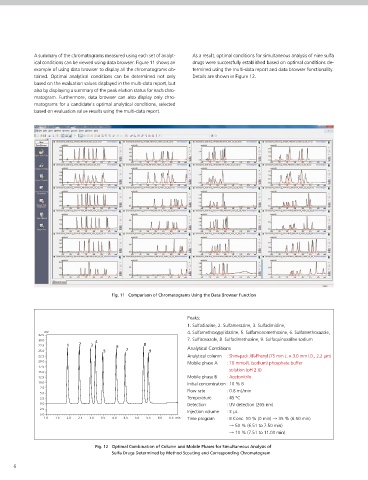
A summary of the chromatograms measured using each set of analyt-  As a result, optimal conditions for simultaneous analysis of nine sulfa
            ical conditions can be viewed using data browser. Figure 11 shows an   drugs were successfully established based on optimal conditions de-
            example of using data browser to display all the chromatograms ob-  termined using the multi-data report and data browser functionality.
            tained.  Optimal  analytical  conditions  can  be  determined  not  only   Details are shown in Figure 12.
            based on the evaluation values displayed in the multi-data report, but
            also by displaying a summary of the peak elution status for each chro-
            matogram.  Furthermore,  data  browser  can  also  display  only  chro-
            matograms for a candidate's optimal analytical conditions, selected
            based on evaluation value results using the multi-data report.


                                      Fig. 11  Comparison of Chromatograms Using the Data Browser Function


                                                               Peaks:
                                                               1. Sulfadiazine, 2. Sulfamerazine, 3. Sulfadimidine,
                mV                                             4. Sulfamethoxypyridazine, 5. Sulfamonomethoxine, 6. Sulfamethoxazole,
              32.5
              30.0               4                             7. Sulfisoxazole, 8. Sulfadimethoxine, 9. Sulfaquinoxaline sodium
              27.5     1   2   3        6        8             Analytical Conditions
              25.0                 5       7      9
              22.5                                             Analytical column  : Shim-pack XR-Phenyl (75 mm L. × 3.0 mm I.D., 2.2 µm)
              20.0
                                                               Mobile phase A    :   10 mmol/L (sodium) phosphate buffer
              17.5
              15.0                                                             solution (pH 2.6)
              12.5                                             Mobile phase B   : Acetonitrile
              10.0                                             Initial concentration : 10 % B
              7.5
              5.0                                              Flow rate    : 0.8 mL/min
              2.5                                              Temperature   : 45 ºC
              0.0                                              Detection    : UV detection (265 nm)
              −2.5
              −5.0                                             Injection volume   : 2 µL
                1. 0  1  .5  2. 0  2  .5  3. 0  3  .5  4. 0  4  .5  5. 0  5  .5  6. 0  6  .5 min  Time program    :   B Conc. 10 % (0 min) ĺ 35 % (6.50 min)
                                                                               ĺ 50 % (6.51 to 7.50 min)
                                                                               ĺ 10 % (7.51 to 11.00 min)

                                 Fig. 12  Optimal Combination of Column and Mobile Phases for Simultaneous Analysis of
                                      Sulfa Drugs Determined by Method Scouting and Corresponding Chromatogram

      6