
Page 9 - Pharmaceutical Solution for Pharma Analysis
P. 9
Application No. C155
News
Estimate of phospholipids by SimLipid Phospholipids in four tissue samples
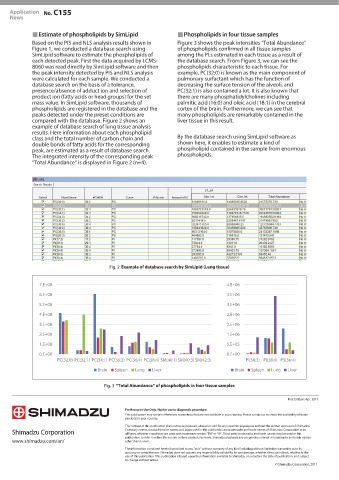
Based on the PIS and NLS analysis results shown in Figure 3 shows the peak intensities “Total Abundance”
Figure 1, we conducted a database search using of phospholipids confirmed in all tissue samples
SimLipid software to estimate the phospholipids of among the PLs estimated in each tissue as a result of
each detected peak. First the data acquired by LCMS- the database search. From Figure 3, we can see the
8060 was read directly by SimLipid software and then phospholipids characteristic to each tissue. For
the peak intensity detected by PIS and NLS analysis example, PC(32:0) is known as the main component of
were calculated for each sample. We conducted a pulmonary surfactant which has the function of
database search on the basis of a tolerance, decreasing the surface tension of the alveoli, and
presence/absence of adduct ion and selection of PC(32:1) is also contained a lot. It is also known that
product ion (fatty acids or head groups) for the set there are many phosphatidylcholines including
mass value. In SimLipid software, thousands of palmitic acid (16:0) and oleic acid (18:1) in the cerebral
phospholipids are registered in the database and the cortex of the brain. Furthermore, we can see that
peaks detected under the preset conditions are many phospholipids are remarkably contained in the
compared with the database. Figure 2 shows an liver tissue in this result.
example of database search of lung tissue analysis
results. Here information about each phospholipid
class and the total number of carbon chain and By the database search using SimLipid software as
double bonds of fatty acids for the corresponding shown here, it enables to estimate a kind of
peak, are estimated as a result of database search. phospholipid contained in the sample from enormous
The integrated intensity of the corresponding peak phospholipids.
“Total Abundance” is displayed in Figure 2 (n=4).
Example of database search by SimLipid (Lung tissue)
7.E+08 4.E+06
6.E+08 3.E+06
5.E+08 3.E+06
4.E+08 2.E+06
3.E+08 2.E+06
2.E+08 1.E+06
1.E+08 5.E+05
0.E+00 0.E+00
PC(32:0) PC(32:1) PC(34:1) PC(36:2) PC(36:4) PC(38:4) SM(40:1) SM(40:3) SM(42:3) PI(38:3) PI(38:4) PS(36:4)
Brain Spleen Lung Liver Brain Spleen Lung Liver
“Total Abundance” of phospholipids in four tissue samples
First Edition: Apr. 2017
For Research Use Only. Not for use in diagnostic procedure.
This publication may contain references to products that are not available in your country. Please contact us to check the availability of these
products in your country.
The content of this publication shall not be reproduced, altered or sold for any commercial purpose without the written approval of Shimadzu.
Company names, product/service names and logos used in this publication are trademarks and trade names of Shimadzu Corporation or its
affiliates, whether or not they are used with trademark symbol “TM” or “£”. Third-party trademarks and trade names may be used in this
publication to refer to either the entities or their products/services. Shimadzu disclaims any proprietary interest in trademarks and trade names
www.shimadzu.com/an/ other than its own.
The information contained herein is provided to you "as is" without warranty of any kind including without limitation warranties as to its
accuracy or completeness. Shimadzu does not assume any responsibility or liability for any damage, whether direct or indirect, relating to the
use of this publication. This publication is based upon the information available to Shimadzu on or before the date of publication, and subject
to change without notice.
© Shimadzu Corporation, 2017