
Page 6 - Pharmaceutical Solution for Pharma Analysis
P. 6
LAAN-A-LM-E120
Application LC/MS
News
Phospholipid analysis using SimLipid software
No. C151
Phospholipids (PLs) have a role of constituting a Sample preparation and analysis
cellular membrane in a living cell and are also related Carbon nano tube (CNT) probe is known as a
to produce various fatty acids such as arachidonic acids, fluorescent probe for a long-wavelength to visualize an
EPA and DHA which are precursors of bioactive lipids. administered target molecule inside a living body. This
Fluctuation of PLs concentration in a blood or a tissue probe was administered to a mouse at a concentration
is also known to be correlated with various disease. For of 300 μg/mL by a tail vein injection (100 μL). After 5hr
example, Hyperlipidemia and arteriosclerosis are of administering, liver tissues were isolated from a
known to induce an elevation of lipid concentration in control mouse and a administered mouse. The isolated
a blood and some nervous diseases are reported to tissues were rapidly frozen in liquid nitrogen and
change the ratio of fatty acid constitution of crushed to some blocks of an appropriate size. Then
phospholipids. Thus although phospholipids are these tissue blocks were weighed. Furthermore, after
reported to be related with various disease, a number crushing frozen tissue blocks by a bead type crusher,
of phospholipid species is enormous. PLs are classified phospholipids were extracted by Bligh & Dyer method.
to glycerophospholipid and sphingophospholipid by Organic phase was recovered and then evaporated.
the structural body. Furthermore, PLs are classified to The sample was dissolved with a solution of
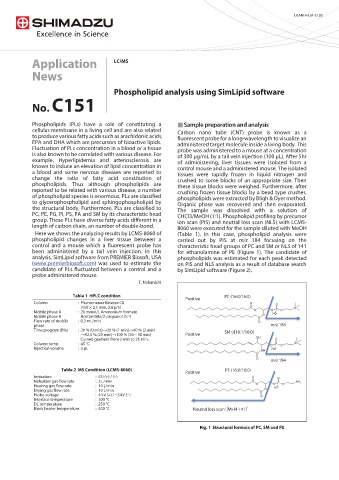
PC, PE, PG, PI, PS, PA and SM by its characteristic head CHCl3/MeOH (1:1). Phospholipid profiling by precursor
group. These PLs have diverse fatty acids different in a ion scan (PIS) and neutral loss scan (NLS) with LCMS-
length of carbon chain, an number of double-bond. 8060 were executed for the sample diluted with MeOH
Here we shows the analyzing results by LCMS-8060 of (Table 1). In this case, phospholipid analysis were
phospholipid changes in a liver tissue between a carried out by PIS at m/z 184 focusing on the
control and a mouse which a fluorescent probe has characteristic head groups of PC and SM or NLS of 141
been administered by a tail vein injection. In this for ethanolamine of PE (Figure 1). The candidate of
analysis, SimLipid software from PREMIER Biosoft, USA phospholipids was estimated for each peak detected
(www.premierbiosoft.com) was used to estimate the on PIS and NLS analysis as a result of database search
candidate of PLs fluctuated between a control and a by SimLipid software (Figure 2).
probe administered mouse.
T. Nakanishi
Table 1 HPLC condition PC (16:0/16:0)
Positive
Column : Phenomenex Kinetex C8 O O
(150 × 2.1 mm, 2.6 μm) P N +
Mobile phase A : 20 mmol/L Ammonium formate O O HO O
Mobile phase B Acetonitrile/2-propanol (1:1) O
Flow rate of mobile : 0.3 mL/min O
phase m/z 184
Time program (B%) : 20 % (0 min)→20 % (1 min)→40 % (2 min) SM (d18:1/16:0)
→92.5 % (25 min)→100 % (26 – 30 min) Positive
Curved gradient from 2 min to 25 min. OH O
Column temp. : 45 °C O P O N +
Injection volume : 3 μL HO
NH
O m/z 184
Table 2 MS Condition (LCMS-8060) PE (16:0/16:0)
Positive
Ionization : ESI (+) / (í) O O
Nebulizer gas flow rate : 3 L/min P NH 2
Heating gas flow rate : 10 L/min O O HO O
Drying gas flow rate : 10 L/min O
Probe voltage : 4 kV (+) / í3 kV (í) O
Interface temperature : 300 °C
DL temperature : 250 °C
Block heater temperature. : 400 °C Neutral loss scan: [M+H-141] +
Structural formula of PC, SM and PE