
Page 7 - Pharmaceutical Solution for Pharma Analysis
P. 7
Application No. C151
News
Database search of phospholipids by SimLipid Phospholipid change in liver tissue by
On the basis of analyzing results by precursor ion scan fluorescent probe dosing
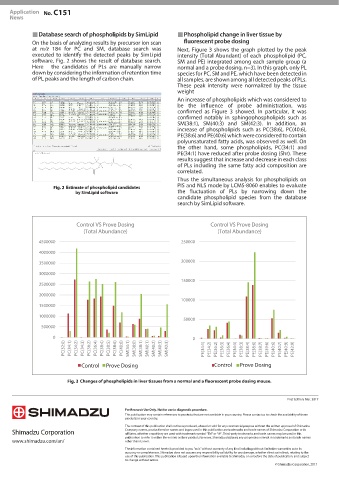
at m/z 184 for PC and SM, database search was Next, Figure 3 shows the graph plotted by the peak
executed to identify the detected peaks by SimLipid intensity (Total Abundant) of each phospholipid (PC,
software. Fig. 2 shows the result of database search. SM and PE) integrated among each sample group (a
Here the candidates of PLs are manually narrow normal and a probe dosing, n=3). In this graph, only PL
down by considering the information of retention time species for PC, SM and PE, which have been detected in
of PL peaks and the length of carbon chain. all samples, are shown among all detected peaks of PLs.
These peak intensity were normalized by the tissue
weight
An increase of phospholipids which was considered to
be the influence of probe administration, was
confirmed as Figure 3 showed. In particular, it was
confirmed notably in sphingophospholipids such as
SM(38:1), SM(40:3) and SM(42:3). In addition, an
increase of phospholipids such as PC(38:6), PC(40:6),
PE(38:6) and PE(40:6) which were considered to contain
polyunsaturated fatty acids, was observed as well. On
the other hand, some phospholipids, PC(34:1) and
PE(34:1) have reduced after probe dosing (5hr). These
results suggest that increase and decrease in each class
of PLs including the same fatty acid composition are
correlated.
Thus the simultaneous analysis for phospholipids on
PIS and NLS mode by LCMS-8060 enables to evaluate
Estimate of phospholipid candidates
by SimLipid software the fluctuation of PLs by narrowing down the
candidate phospholipid species from the database
search by SimLipid software.
Control VS Prove Dosing Control VS Prove Dosing
(Total Abundance) (Total Abundance)
4500000 250000
4000000
3500000 200000
3000000
150000
2500000
2000000
100000
1500000
1000000
50000
500000
0 0
PC(32:0) PC(34:1) PC(34:2) PC(34:3) PC(36:2) PC(36:4) PC(38:4) PC(38:5) PC(38:6) PC(40:6) SM(34:1) SM(38:0) SM(38:1) SM(40:1) SM(40:2) SM(40:3) SM(42:3) PE(34:1) PE(34:2) PE(36:2) PE(36:3) PE(36:4) PE(36:5) PE(38:3) PE(38:4) PE(38:6) PE(38:7) PE(39:6) PE(40:6) PE(40:7) PE(40:9) PE(42:9)
䝥䝻䞊䝤ᢞ
ᮍᢞ
ᮍᢞ
Prove Dosing
Control 䝥䝻䞊䝤ᢞ Control Prove Dosing
Changes of phospholipids in liver tissues from a normal and a fluorescent probe dosing mouse.
First Edition: Mar. 2017
For Research Use Only. Not for use in diagnostic procedure.
This publication may contain references to products that are not available in your country. Please contact us to check the availability of these
products in your country.
The content of this publication shall not be reproduced, altered or sold for any commercial purpose without the written approval of Shimadzu.
Company names, product/service names and logos used in this publication are trademarks and trade names of Shimadzu Corporation or its
affiliates, whether or not they are used with trademark symbol “TM” or “£”. Third-party trademarks and trade names may be used in this
publication to refer to either the entities or their products/services. Shimadzu disclaims any proprietary interest in trademarks and trade names
www.shimadzu.com/an/ other than its own.
The information contained herein is provided to you "as is" without warranty of any kind including without limitation warranties as to its
accuracy or completeness. Shimadzu does not assume any responsibility or liability for any damage, whether direct or indirect, relating to the
use of this publication. This publication is based upon the information available to Shimadzu on or before the date of publication, and subject
to change without notice.
© Shimadzu Corporation, 2017