
Page 8 - Pharmaceutical Solution for Pharma Analysis
P. 8
LAAN-A-LM-E125
Application LC/MS
News
Phospholipid analysis for four types of mouse
tissues
No. C155
Phospholipids, a complex lipid, play a major role in Sample preparation and analysis
formation of lipid bilayer as a major component of the Lipid extraction from each tissue was performed using
cell membrane together with glycolipids and methanol. The prepared tissue extract was diluted
cholesterol in vivo. In addition to constituting cell appropriately with methanol and then phospholipids
membranes, it also function as a source of fatty acids were analyzed by precursor ion scan (PIS) and neutral
involved in energy production by lipid metabolism, loss scan (NLS) with LCMS-8060. In this analysis,
lipid transport and signal transduction. Thus, although PIS/NLS for the characteristic head group and PIS for
a phospholipid works for various function in vivo, its representative fatty acids, FA(16:0), FA(18:0), FA(18:1),
number is enormous because of the combination of a FA(20:4), FA(20:5), FA(22:4), FA(22:5) and FA(22:6),
characteristic head group and fatty acid constituting were performed. The LC and MS analysis in this
its structure. Therefore, in the field of lipidomics, experiment, are analyzed under the same analysis
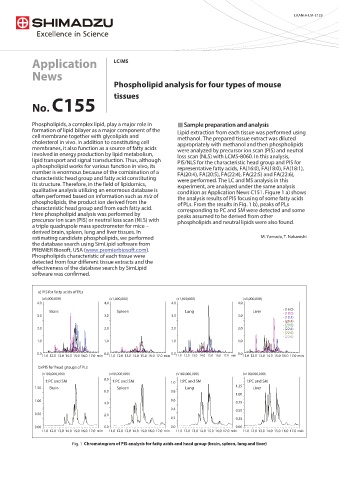
qualitative analysis utilizing an enormous database is condition as Application News C151. Figure 1 a) shows
often performed based on information such as m/z of the analysis results of PIS focusing of some fatty acids
phospholipids, the product ion derived from the of PLs. From the results in Fig. 1 b), peaks of PLs
characteristic head group and from each fatty acid. corresponding to PC and SM were detected and some
Here phospholipid analysis was performed by peaks assumed to be derived from other
precursor ion scan (PIS) or neutral loss scan (NLS) with phospholipids and neutral lipids were also found.
a triple quadrupole mass spectrometer for mice –
derived brain, spleen, lung and liver tissues. In
estimating candidate phospholipids, we performed M. Yamada, T. Nakanishi
the database search using SimLipid software from
PREMIER Biosoft, USA (www.premierbiosoft.com).
Phospholipids characteristic of each tissue were
detected from four different tissue extracts and the
effectiveness of the database search by SimLipid
software was confirmed.
a) PIS for fatty acids of PLs
(x1,000,000) (x1,000,000) (x1,000,000) (x1,000,000)
4.0 4.0 4.0 4.0
- (16:0)
Brain Spleen Lung Liver - (18:0)
3.0 3.0 3.0 3.0 - (18:1)
- (20:4)
- (20:5)
2.0 2.0 2.0 2.0 - (22:4)
- (22:5)
- (22:6)
1.0 1.0 1.0 1.0
0.0 0.0 0.0 0.0
11.0 12.0 13.0 14.0 15.0 16.0 17.0 min 11.0 12.0 13.0 14.0 15.0 16.0 17.0 min 11.0 12.0 13.0 14.0 15.0 16.0 17.0 min 11.0 12.0 13.0 14.0 15.0 16.0 17.0 min
b) PIS for head groups of PLs
(x100,000,000) (x10,000,000) (x100,000,000) (x100,000,000)
8.0
1:PC and SM 1:PC and SM 1.0 1:PC and SM 1:PC and SM
1.50 Brain Spleen Lung 1.25 Liver
6.0 0.8
1.00
1.00 0.6
4.0 0.75
0.4
0.50
0.50 2.0
0.2 0.25
0.00 0.0 0.0 0.00
11.0 12.0 13.0 14.0 15.0 16.0 17.0 min 11.0 12.0 13.0 14.0 15.0 16.0 17.0 min 11.0 12.0 13.0 14.0 15.0 16.0 17.0 min 11.0 12.0 13.0 14.0 15.0 16.0 17.0 min
Chromatogram of PIS analysis for fatty acids and head group (brain, spleen, lung and liver)