Page 84 - Application Notebook - Solution for Food Safety
P. 84

Application  No.C141
    News

                                                  Table 1  Analytical Conditions

                 System        : Nexera X2                               System        : LCMS-8060
                 Column        : Shim-pack XR-ODS ᶘ                      Ionization    : Heated ESI
                                 (50 mm L. × 2 mm I.D., 1.6 μm)          Probe Voltage   : +1 kV (positive ionization)
                 Column Temperature  : 40 °C                             Temperature   : Interface: 250 °C
                 Mobile Phases   : A: Water + 0.1 % formic acid                          Desolvation Line: 150 °C
                                 B: Acetonitrile                                         Heater Block: 200 °C
                 Flowrate      : 500 μL/min                              Gas Flow      : Nebulizing Gas: 3 L/min
                 Gradient      : 2 %B (0.00 min) > 25 %B (7.00 min) >                    Heating Gas: 20 L/min
                                 95 %B (7.10-8.00 min) > 2 %B (8.10-10.00 min)           Drying Gas: 5 L/min
                 Injection Volume   : 10 μL


                                               Table 2  MS/MS Acquisition Parameters
                        MRM Transitions  Name        Polarity  Quan     Qual1        Qual2
                                       EGEQEWGTPGSEVR  +    780.85 > 802.40  780.85 > 644.35  780.85 > 316.10
                                       NNPFYFPSR     +      571.25 > 669.35  571.25 > 506.25  571.25 > 229.10
                                       IPSGFISYILNR  +      690.40 > 765.45  690.40 > 211.15  690.40 > 502.25
                                       SSDNEGVIVK    +      524.25 > 515.35  524.25 > 359.25  524.25 > 175.05
                                       GSEEEDITNPINLR  +    793.90 > 726.45  793.90 > 612.40  793.90 > 402.25
                                       GTGNLELVAVR   +      564.80 > 686.40  564.80 > 557.40  564.80 > 444.30
                                       EGEQEWGTPGSHVR  +    784.85 > 652.35  784.85 > 555.30  784.85 > 316.10
                                       SSENNEGVIVK   +      588.30 > 515.35  588.30 > 359.25  588.30 > 246.20
                                       GSEEEGDITNPINLR  +   822.40 > 726.45  822.40 > 612.40  822.40 > 402.25

                        Dwell Time    : 41 to 130 msec depending upon the number of concomitant transitions to ensure to have at
                                       least 15 points per peak (max total loop time 400 msec).
                        Pause Time    : 3 msec
                        CID Pressure  : 300 kPa
                        Quadrupole Resolution : Q1: Unit    Q3: Unit


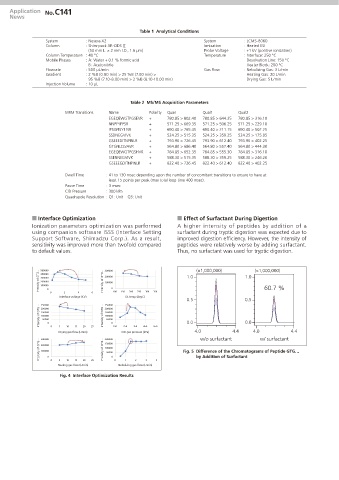
            Q Interface Optimization                           Q Effect of Surfactant During Digestion
            Ionization parameters optimization was performed   A higher intensity of peptides by addition of a
            using companion software ISSS (Interface Setting   surfactant during tryptic digestion was expected due to
            Support Software, Shimadzu Corp.). As a result,    improved digestion efficiency. However, the intensity of
            sensitivity was improved more than twofold compared   peptides were relatively worse by adding surfactant.
            to default values.                                 Thus, no surfactant was used for tryptic digestion.


               Intensity of GTG...  500000  Intensity of GTG...  300000 0  1.0  (×1,000,000)  1.0  (×1,000,000)
               400000
                                      200000
               300000
               200000
                                      100000
               100000
                                                                                              60.7 %
                  0
                                                 250
                                              200
                            4
                   0
                        2
                      Interface voltage (KV)  6  100  150  DL temp (degC) 300  350
                                                                   0.5                 0.5
                                      250000
               250000
               Intensity of GTG...  200000 0  Intensity of GTG...  200000 0  0.0       0.0
                                      150000
               150000
                                      100000
               100000
                50000
                                      50000
                                                   450
                                                350
                                            250
                              20
                           15
                   0
                      5
                        10
                      Drying gas flow (L/min)  25  200000  150  CID gas pressure (kPa)  550  4.0 w/o surfactant 4.4  4.0 w/ surfactant  4.4
               300000
               Intensity of GTG...  200000 0  Intensity of GTG...  150000 0  Fig. 5  Difference of the Chromatograms of Peptide GTG…
                                      100000
               100000
                                      50000
                                                                      by Addition of Surfactant
                   0
                                                    3
                                                2
                              20
                        10
                           15
                                             1
                      5
                     Heating gas flow (L/min)  25  0  Nebulizing gas flow (L/min)  4
                      Fig. 4  Interface Optimization Results
   79   80   81   82   83   84   85   86   87   88   89