Page 82 - Application Notebook - Solution for Food Safety
P. 82

SCA_210_041


         Calibration                                            Area
                                                                3.400e6  y = 67657490x + 6167.372
                                                                    R² = 0.9989034    R = 0.9994516
                                                                3.200e6  Curve Fit: Default (Linear)
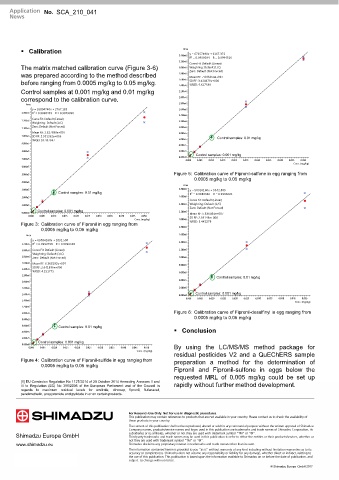
        The matrix matched calibration curve (Figure 3-6)       3.000e6 Weighting: Default (1/C)
                                                                    Zero: Default (Not Forced)
        was prepared according to the method described          2.800e6  Mean RF: 7.093854e+007
        before ranging from 0.0005 mg/kg to 0.05 mg/kg.         2.600e6  SD RF: 3.424479e+006
                                                                2.400e6 %RSD: 4.827389
        Control samples at 0.001 mg/kg and 0.01 mg/kg           2.200e6
        correspond to the calibration curve.                    2.000e6
          Area                                                  1.800e6
            y = 26804740x + 2767.185                            1.600e6
         1.300e6 R² = 0.9898439    R = 0.9949090
                                                                1.400e6
            Curve Fit: Default (Linear)
         1.200e6                                                1.200e6
            Weighting: Default (1/C)
            Zero: Default (Not Forced)                          1.000e6
         1.100e6
            Mean RF: 2.827688e+007                              8.000e5
         1.000e6 SD RF: 2.951362e+006                                        Control samples: 0.01 mg/kg
            %RSD: 10.437367                                     6.000e5
         9.000e5
                                                                4.000e5
         8.000e5                                                2.000e5
                                                                      Control samples: 0.001 mg/kg
                                                                0.000e0
         7.000e5                                                  0.000  0.005  0.010  0.015  0.020  0.025  0.030  0.035  0.040  0.045  0.050
                                                                                                        Conc. (mg/kg)
         6.000e5
         5.000e5                                              Figure 5:  Calibration curve of Fipronil-sulfone in egg ranging from
                                                                     0.0005 mg/kg to 0.05 mg/kg
         4.000e5
                                                                 Area
         3.000e5                                                2.800e6  y = 50916160x + 5542.805
                      Control samples: 0.01 mg/kg                   R² = 0.9986046    R = 0.9993021
         2.000e5                                                2.600e6
                                                                    Curve Fit: Default (Linear)
                                                                2.400e6 Weighting: Default (1/C)
         1.000e5
                                                                    Zero: Default (Not Forced)
              Control samples: 0.001 mg/kg                      2.200e6
         0.000e0                                                    Mean RF: 5.386494e+007
           0.000  0.005  0.010  0.015  0.020  0.025  0.030  0.035  0.040  0.045  0.050  SD RF: 2.93148e+006
                                                Conc. (mg/kg)   2.000e6  %RSD: 5.442279
        Figure 3:  Calibration curve of Fipronil in egg ranging from
               0.0005 mg/kg to 0.05 mg/kg                       1.800e6
          Area                                                  1.600e6
            y = 63084160x + 1031.500
         3.200e6 R² = 0.9992798    R = 0.9996398                1.400e6
         3.000e6 Curve Fit: Default (Linear)                    1.200e6
            Weighting: Default (1/C)
         2.800e6  Zero: Default (Not Forced)                    1.000e6
         2.600e6 Mean RF: 6.363292e+007                         8.000e5
            SD RF: 2.641896e+006
         2.400e6
            %RSD: 4.151775                                      6.000e5
         2.200e6                                                             Control samples: 0.01 mg/kg
                                                                4.000e5
         2.000e6
         1.800e6                                                2.000e5
         1.600e6                                                0.000e0  Control samples: 0.001 mg/kg
                                                                  0.000  0.005  0.010  0.015  0.020  0.025  0.030  0.035  0.040  0.045  0.050
         1.400e6
                                                                                                         Conc. (mg/kg)
         1.200e6
         1.000e6                                              Figure 6:  Calibration curve of Fipronil-desulfinyl in egg ranging from
                                                                     0.0005 mg/kg to 0.05 mg/kg
         8.000e5
         6.000e5      Control samples: 0.01 mg/kg
         4.000e5                                               Conclusion
         2.000e5
               Control samples: 0.001 mg/kg
         0.000e0
           0.000  0.005  0.010  0.015  0.020  0.025  0.030  0.035  0.040  0.045  0.050  By using the LC/MS/MS method package for
                                                 Conc. (mg/kg)
                                                              residual pesticides V2 and a QuEChERS sample
        Figure 4:  Calibration curve of Fipronil-sulfide in egg ranging from  preparation a method for the determination of
               0.0005 mg/kg to 0.05 mg/kg
                                                              Fipronil and Fipronil-sulfone in eggs below the
                                                              requested MRL of 0.005 mg/kg could be set up
        [1] EU Comission Regulation No 1127/2014 of 20 October 2014 Amending Annexes II and
        III to Regulation (EC) No 396/2005 of the European Parliament and of the Council in  rapidly without further method development.
        regards  to  maximum  residual  levels  for  amitrole,  dinocap,  fipronil,  flufenacet,
        pendimethalin, propyzamide and pyridate in or on certain products.
       Shimadzu Europa GmbH
       www.shimadzu.eu

                                                                                                © Shimadzu Europa GmbH 2017
   77   78   79   80   81   82   83   84   85   86   87