Page 83 - Application Notebook - Solution for Food Safety
P. 83

LAAN-A-LM-E112


            Application                  Liquid Chromatography Mass Spectrometry

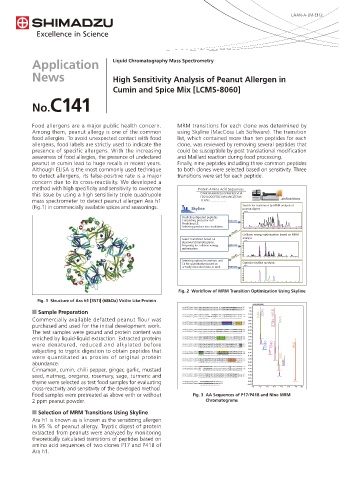
            News                         High Sensitivity Analysis of Peanut Allergen in

                                         Cumin and Spice Mix [LCMS-8060]
            No.C141


            Food allergens are a major public health concern.   MRM transitions for each clone was determined by
            Among them, peanut allergy is one of the common    using Skyline (MacCoss Lab Software). The transition
            food allergies. To avoid unexpected contact with food   list, which contained more than ten peptides for each
            allergens, food labels are strictly used to indicate the   clone, was reviewed by removing several peptides that
            presence of specific allergens. With the increasing   could be susceptible by post translational modification
            awareness of food allergies, the presence of undeclared   and Maillard reaction during food processing.
            peanut in cumin lead to huge recalls in recent years.   Finally, nine peptides including three common peptides
            Although ELISA is the most commonly used technique   to both clones were selected based on sensitivity. Three
            to detect allergens, its false-positive rate is a major   transitions were set for each peptide.
            concern due to its cross-reactivity. We developed a
            method with high specificity and sensitivity to overcome    Protein Amino Acid Sequences.
            this issue by using a high sensitivity triple quadrupole   DTHKSEIAHRFKDLGEEHFKGLVLIA
                                                                       FSQYLQQCPFDEHVKLVNELTEFAK
            mass spectrometer to detect peanut allergen Ara h1         TCVAD......................
            (Fig.1) in commercially available spices and seasonings.                  Search for transitions by MRM analysis of
                                                                                      peanut digest.
                                                                                       (×10,000,000)
                                                                                      2.00
                                                                                      1.75
                                                                 Predicting digested peptides.   1.50 1.25
                                                                 Calculating precursor m/z.  Method file  1.00 0.75
                                                                 Predicting CE.       0.50
                                                                 Selecting product ion candidates.  0.00 0.25
                                                                                       0.0  1.0  2.0  3.0  4.0  5.0  6.0  7.0  8.0  9.0  min
                                                                                  Data file
                                                                                      Collision energy optimization based on MRM
                                                                 Select transitions based on   analysis.
                                                                                       (×1,000,000)
                                                                                      2.00
                                                                 observed chromatograms.  1.75
                                                                 Preparing for collision energy   Method file  1.50
                                                                                      1.25
                                                                 optimization.        1.00
                                                                                      0.75
                                                                                      0.50 0.25
                                                                                  Data file  0.00  1.5  2.0  2.5  3.0  3.5  4.0  4.5  5.0  5.5  6.0  6.5  7.0  min
                                                                 Selecting optimal transitions and
                                                                 CE for quantitation based on  Optimized MRM methods
                                                                 actually measured data as well.  Method file  2.00  (x1,000,000)
                                                                                      1.75
                                                                                      1.50
                                                                                      1.25
                                                                                      1.00
                                                                                      0.75
                                                                                      0.50
                                                                                      0.25
                                                                                      0.00
                                                                                        1.5  2.0  2.5  3.0  3.5  4.0  4.5  5.0  5.5  6.0  6.5  7.0  min
                                                                Fig. 2  Workflow of MRM Transition Optimization Using Skyline
              Fig. 1  Structure of Ara h1 [3S7I] (68kDa) Vicilin Like Protein
                                                                                          (×10,000,000)
                                                                                        1.15
            Q Sample Preparation                                                        1.10  SSEN...  SSDN...
                                                                                        1.05
                                                                                        1.00     GTGN... (×0.2)
            Commercially available defatted peanut flour was                            0.95        NNPF...
            purchased and used for the initial development work.                        0.90
                                                                                        0.85
            The test samples were ground and protein content was                        0.80
                                                                                        0.75
            enriched by liquid-liquid extraction. Extracted proteins                    0.70
                                                                                        0.65
            were denatured, reduced and alkylated before                                0.60  EGEQ...  EGEQ...  IPSG...
                                                                                        0.55
            subjecting to tryptic digestion to obtain peptides that                     0.50
                                                                                        0.45
            were quantitated as proxies of original protein                             0.40        GSEE...
                                                                                        0.35
            abundance.                                                                  0.30         NNPF...
                                                                                        0.25
            Cinnamon, cumin, chilli pepper, ginger, garlic, mustard                     0.20
                                                                                        0.15
            seed, nutmeg, oregano, rosemary, sage, turmeric and                         0.10
                                                                                        0.05
            thyme were selected as test food samples for evaluating                     -0.05
                                                                                        0.00
            cross-reactivity and sensitivity of the developed method.                    1.0  2.0  3.0  4.0  5.0  6.0  7.0  min
            Food samples were pretreated as above with or without    Fig. 3  AA Sequences of P17/P41B and Nine MRM
            2 ppm peanut powder.                                         Chromatograms
            Q Selection of MRM Transitions Using Skyline
            Ara h1 is known as is known as the sensitizing allergen
            in 95 % of peanut allergy. Tryptic digest of protein
            extracted from peanuts were analyzed by monitoring
            theoretically calculated transitions of peptides based on
            amino acid sequences of two clones P17 and P41B of
            Ara h1.
   78   79   80   81   82   83   84   85   86   87   88