Page 88 - Application Notebook - Solution for Food Safety
P. 88

Application   No. AD-0095
    News


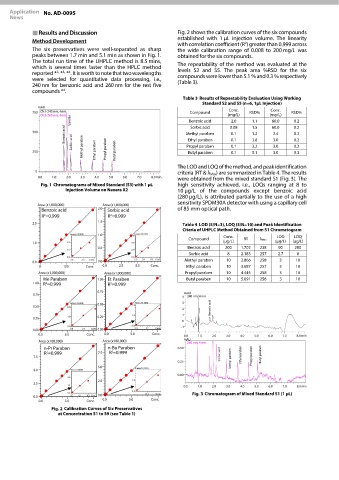
              Results and Discussion                          Fig. 2 shows the calibration curves of the six compounds
                                                               established with 1 μL  injection volume. The linearity
            Method Development                                                         2
                                                               with correlation coefficient (R ) greater than 0.999 across
            The six preservatives were well-separated as sharp   the wide calibration range  of 0.008 to 200 mg/L was
            peaks between 1.7 min and 5.1 min as shown in Fig. 1.   obtained for the six compounds.
            The total run time of the UHPLC method is 8.5 mins,
            which is several times faster than the HPLC method   The repeatability of the method was evaluated at the
                                                               levels  S2 and S5. The peak  area %RSD for  the six
                       3,
                         4
                     2,
            reported *  *  * . It is worth to note that two wavelengths
            were selected for  quantitative data processing, i.e.,   compounds were lower than 5.1 % and 0.3 % respectively
                                                               (Table 3).
            240 nm for benzonic  acid  and 260 nm for  the rest five
                       4
            compounds * .
                                                                 Table 3  Results of Repeatability Evaluation Using Working
                                                                        Standard S2 and S5 (n=6, 1μL Injection)
                                                                                 Conc.          Conc.
                                                                    Compound             RSD%          RSD%
                                                                                 (mg/L)         (mg/L)
                                                                   Benzoic acid   2.0     1.1    60.0   0.2
                                                                    Sorbic acid   0.08    1.5    60.0   0.2
                                                                  Methyl paraben  0.1     1.2    2.4    0.2
                                                                   Ethyl paraben  0.1     3.8    3.0    0.2
                                                                   Propyl paraben  0.1    3.2    3.0    0.2
                                                                   Butyl paraben  0.1     5.1    3.0    0.3
                                                               The LOD and LOQ of the method, and peak identification
                                                               criteria (RT & λ Max) are summarized in Table 4. The results
                                                               were obtained from the mixed standard S1 (Fig. 3). The
                    Chromatograms of Mixed Standard (S3) with 1 μL   high sensitivity achieved, i.e., LOQs  ranging at 8 to
                        Injection Volume on Nexera X2          10 μg/L of the compounds except benzoic acid
                                                               (280 μg/L), is attributed partially to the use of a high
                                                               sensitivity SPDM30A detector with using a capillary cell
                                                               of 85 mm optical path.


                                                                 Table 4  LOD (S/N=3), LOQ (S/N=10) and Peak Identification
                                                                 Citeria of UHPLC Method Obtained from S1 Chromatogram
                                                                                Conc.             LOD   LOQ
                                                                   Compound            RT   λMax
                                                                               (μg/L)             (μg/L)  (μg/L)
                                                                   Benzoic acid  200  1.702   238   90   280
                                                                   Sorbic acid   8    2.183   257   2.7  8
                                                                  Methyl paraben  10  2.866   258   3    10
                                                                  Ethyl paraben  10   3.687   257   3    10
                                                                  Propyl paraben  10  4.445   258   3    10
                                                                  Butyl paraben  10   5.091   256   3    10


                                                                         Chromatogram of Mixed Standard S1 (1 μL)

                        Calibration Curves of Six Preservatives
                     at Concentration S1 to S9 (see Table 1)
   83   84   85   86   87   88   89   90   91   92   93