
Page 92 - Application Notebook - Solution for Food Safety
P. 92
Application No. AD-0096 N
News
Calibration Curves, Range and Linearity
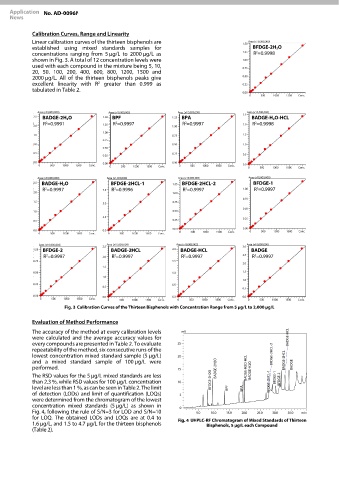
Linear calibration curves of the thirteen bisphenols are
established using mixed standards samples for
concentrations ranging from 5 μg/L to 2000 μg/L as
shown in Fig. 3. A total of 12 concentration levels were
used with each compound in the mixture being 5, 10,
20, 50. 100, 200, 400, 600, 800, 1200, 1500 and
2000 μg/L. All of the thirteen bisphenols peaks give
2
excellent linearity with R greater than 0.999 as
tabulated in Table 2.
Calibration Curves of the Thirteen Bisphenols with Concentration Range from 5 μg/L to 2,000 μg/L
Evaluation of Method Performance
The accuracy of the method at every calibration levels
were calculated and the average accuracy values for
every compounds are presented in Table 2. To evaluate
repeatability of the method, six consecutive runs of the
lowest concentration mixed standard sample (5 μg/L)
and a mixed standard sample of 100 μg/L were
performed.
The RSD values for the 5 μg/L mixed standards are less
than 2.3 %, while RSD values for 100 μg/L concentration
level are less than 1 %, as can be seen in Table 2. The limit
of detection (LODs) and limit of quantification (LOQs)
were determined from the chromatogram of the lowest
concentration mixed standards (5 μg/L) as shown in
Fig. 4, following the rule of S/N=3 for LOD and S/N=10
for LOQ. The obtained LODs and LOQs are at 0.4 to UHPLC-RF Chromatogram of Mixed Standards of Thirteen
1.6 μg/L, and 1.5 to 4.7 μg/L for the thirteen bisphenols Bisphenols, 5 μg/L each Compound
(Table 2).