
Page 21 - Application Notebook - Solution for Food Safety
P. 21
Application No.C136
News
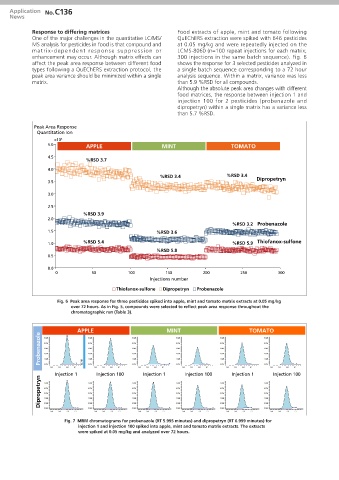
Response to differing matrices Food extracts of apple, mint and tomato following
One of the major challenges in the quantitative LC/MS/ QuEChERS extraction were spiked with 646 pesticides
MS analysis for pesticides in food is that compound and at 0.05 mg/kg and were repeatedly injected on the
matrix-dependent response suppression or LCMS-8060 (n=100 repeat injections for each matrix;
enhancement may occur. Although matrix effects can 300 injections in the same batch sequence). Fig. 6
affect the peak area response between different food shows the response for 3 selected pesticides analyzed in
types following a QuEChERS extraction protocol, the a single batch sequence corresponding to a 72 hour
peak area variance should be minimized within a single analysis sequence. Within a matrix, variance was less
matrix. than 5.9 %RSD for all compounds.
Although the absolute peak area changes with different
food matrices, the response between injection 1 and
injection 100 for 2 pesticides (probenazole and
dipropetryn) within a single matrix has a variance less
than 5.7 %RSD.
Peak Area Response
Quantitation Ion
×10 6
5.0 APPLE MINT TOMATO
4.5
%RSD 3.7
4.0
%RSD 3.4 %RSD 3.4 Dipropetryn
3.5
3.0
2.5
%RSD 3.9
2.0
%RSD 3.2 Probenazole
1.5 %RSD 3.6
1.0 %RSD 5.4 %RSD 5.9 Thiofanox-sulfone
%RSD 5.8
0.5
0.0
0 50 100 150 200 250 300
Injections number
Thiofanox-sulfone Dipropetryn Probenazole
Fig. 6 Peak area response for three pesticides spiked into apple, mint and tomato matrix extracts at 0.05 mg/kg
over 72 hours. As in Fig. 5, compounds were selected to reflect peak area response throughout the
chromatographic run (Table 3).
APPLE MINT TOMATO
Probenazole
Injection 1 Injection 100 Injection 1 Injection 100 Injection 1 Injection 100
Dipropetryn
Fig. 7 MRM chromatograms for probenazole (RT 5.995 minutes) and dipropetryn (RT 6.999 minutes) for
injection 1 and injection 100 spiked into apple, mint and tomato matrix extracts. The extracts
were spiked at 0.05 mg/kg and analyzed over 72 hours.