Page 19 - Application Notebook - Solution for Food Safety
P. 19

Application  No.C136
    News

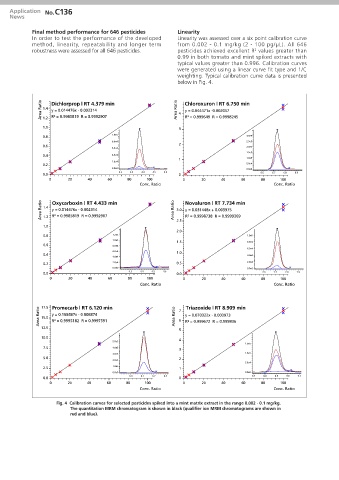
            Final method performance for 646 pesticides        Linearity
            In order to test the performance of the developed   Linearity was assessed over a six point calibration curve
            method, linearity, repeatability and longer term   from 0.002 - 0.1 mg/kg (2 - 100 pg/μL). All 646
            robustness were assessed for all 646 pesticides.   pesticides achieved excellent R  values greater than
                                                                                          2
                                                               0.99 in both tomato and mint spiked extracts with
                                                               typical values greater than 0.996. Calibration curves
                                                               were generated using a linear curve fit type and 1/C
                                                               weighting. Typical calibration curve data is presented
                                                               below in Fig. 4.


               Area Ratio  1.4  Dichlorprop | RT 4.379 min     Area Ratio  4  Chloroxuron | RT 6.750 min
                   y = 0.014476x - 0.002314
                                                                  y = 0.044471x -0.002057
                   R² = 0.9985819  R = 0.9992907
                                                                  R² = 0.999649  R = 0.9998245
                1.2
                1.0                                             3
                0.8                     1.0e5                                           3.0e5
                                        8.0e4                                           2.5e5
                0.6                                             2                       2.0e5
                                        6.0e4
                                                                                        1.5e5
                0.4                     4.0e4
                                                                1                       1.0e5
                                        2.0e4
                0.2                                                                     5.0e4
                                        0.0e0                                           0.0e0
                                           4.2  4.3  4.4  4.5  4.6                           6.6  6.7  6.8  6.9
                0.0                                             0
                  0      20     40     60     80    100          0      20     40     60     80    100
                                                  Conc. Ratio                                    Conc. Ratio
               Area Ratio  1.4  y = 0.014476x - 0.002314      Area Ratio  3.0  Novaluron | RT 7.734 min
                   Oxycarboxin | RT 4.433 min
                                                                  y = 0.031448x + 0.003975
                   R² = 0.9985819  R = 0.9992907
                                                                  R² = 0.9998738  R = 0.9999369
                1.2
                1.0                                            2.5
                                                               2.0
                0.8                      1.2e5                                          1.0e5
                                         1.0e5                 1.5                      8.0e4
                0.6                      8.0e4
                                                                                        6.0e4
                                         6.0e4                 1.0
                0.4                                                                     4.0e4
                                         4.0e4
                0.2                      2.0e4                 0.5                      2.0e4
                                         0.0e0                                          0.0e0
                                              4.3  4.4  4.5  4.6
                0.0                                            0.0                           7.6  7.7  7.8  7.9
                  0      20     40     60     80     100         0      20     40     60     80    100
                                                  Conc. Ratio                                    Conc. Ratio

                                                                  Triazoxide | RT 8.909 min
                   Promecarb | RT 6.120 min
               Area Ratio  17.5  y = 0.168487x - 0.008874     Area Ratio  7 6  y = 0.070322x - 0.003973
                15.0
                   R² = 0.9995182  R = 0.9997591
                                                                  R² = 0.999672  R = 0.999836
                12.5
                                                                5
                10.0
                                         5.0e5                  4
                                                                                       1.5e5
                7.5                      4.0e5                  3
                                         3.0e5                                         1.0e5
                5.0                                             2
                                         2.0e5
                                                                                       5.0e4
                2.5                      1.0e5                  1
                                         0.0e0                                         0.0e0
                0.0                           6.0  6.1  6.2  6.3  0                       8.7  8.8  8.9  9.0  9.1
                  0      20     40     60    80     100          0      20     40     60     80    100
                                                  Conc. Ratio                                    Conc. Ratio
                     Fig. 4  Calibration curves for selected pesticides spiked into a mint matrix extract in the range 0.002 - 0.1 mg/kg.
                          The quantitation MRM chromatogram is shown in black (qualifier ion MRM chromatograms are shown in
                          red and blue).
   14   15   16   17   18   19   20   21   22   23   24