
Page 26 - Application Notebook - Solution for Food Safety
P. 26
Application No. C154
News
Method performance
Number of MRMs
160
140
120
100
80
60
40
20
0
0.0 1.0 2.0 3.0 4.0 5.0 6.0 7.0 8.0 9.0 10.0 11.0 12.0min
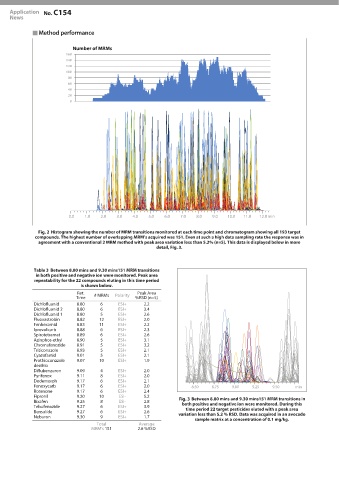
Histogram showing the number of MRM transitions monitored at each time point and chromatogram showing all 193 target
compounds. The highest number of overlapping MRM’s acquired was 151. Even at such a high data sampling rate the response was in
agreement with a conventional 2 MRM method with peak area variation less than 5.2% (n=5). This data is displayed below in more
detail, Fig. 3.
Table 3 Between 8.80 mins and 9.30 mins151 MRM transitions
in both positive and negative ion were monitored. Peak area
repeatability for the 22 compounds eluting in this time period
is shown below.
Ret. Peak Area
Time # MRMs Polarity %RSD (n=5)
Dichlofluanid 8.80 6 ESI+ 2.2
Dichlofluanid 2 8.80 6 ESI+ 3.4
Dichlofluanid 1 8.80 5 ESI+ 2.6
Fluoxastrobin 8.82 12 ESI+ 2.0
Fenhexamid 8.83 11 ESI+ 2.2
Iprovalicarb 8.88 6 ESI+ 2.3
Spirotetramat 8.89 6 ESI+ 2.6
Azinphos-ethyl 8.90 5 ESI+ 3.1
Chromafenozide 8.91 5 ESI+ 3.2
Triticonazole 8.93 5 ESI+ 2.1
Cyazofamid 9.01 5 ESI+ 2.1
Prothioconazole 9.07 10 ESI+ 1.9
desthio
Diflubenzuron 9.09 4 ESI+ 2.0
Pyrifenox 9.11 8 ESI+ 2.0
Dodemorph 9.17 6 ESI+ 2.1
Fenoxycarb 9.17 6 ESI+ 2.0 8.50 8.75 9.00 9.25 9.50 min
Rotenone 9.17 6 ESI+ 2.4
Fipronil 9.20 10 ESI- 5.2 Between 8.80 mins and 9.30 mins151 MRM transitions in
Bixafen 9.25 8 ESI- 2.8 both positive and negative ion were monitored. During this
Tebufenozide 9.27 6 ESI+ 3.9 time period 22 target pesticides eluted with a peak area
Bensulide 9.27 6 ESI+ 2.6 variation less than 5.2 % RSD. Data was acquired in an avocado
Neburon 9.30 9 ESI+ 1.7
sample matrix at a concentration of 0.1 mg/kg.
Total Average
MRM’s 151 2.6 %RSD