Page 30 - Application Notebook - Solution for Food Safety
P. 30

Application   No. C154
    News


            „  Quantitation
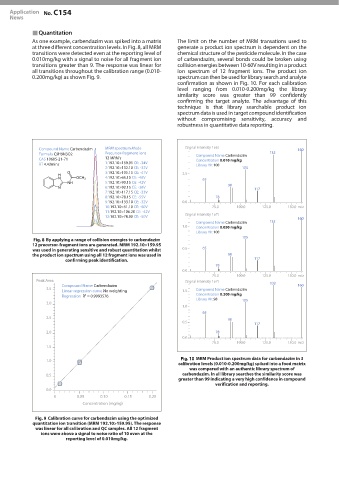
            As one example, carbendazim was spiked into a matrix   The limit on the number of MRM transations used to
            at three different concentration levels. In Fig. 8, all MRM   generate a product ion spectrum is dependent on the
            transitions were detected even at the reporting level of   chemical structure of the pesticide molecule. In the case
            0.010mg/kg with a signal to noise for all fragment ion   of carbendazim, several bonds could be broken using
            transitions greater than 9. The response was linear for   collision energies between 10-60V resulting in a product
            all transitions throughout the calibration range (0.010-  ion spectrum of 12 fragment ions. The product ion
            0.200mg/kg) as shown Fig. 9.                       spectrum can then be used for library search and analyte
                                                               confirmation as shown in Fig. 10. For each calibration
                                                               level ranging from 0.010-0.200mg/kg  the library
                                                               similarity score was greater than 99  confidently
                                                               confirming  the target  analyte. The  advantage of this
                                                               technique is  that library  searchable product  ion
                                                               spectrum data is used in target compound identification
                                                               without compromising sensitivity, accuracy  and
                                                               robustness in quantitative data reporting.


               Compound Name Carbendazim  MRM spectrum Mode       (Signal intensity 1e6)                  160
               Formula C9H9N3O2       Precursor-fragment ions         Compound Name Carbendazim  132
               CAS 10605-21-71        12 MRM’s                        Concentration 0.010 mg/kg
               RT 4.42mins            1:192.10>159.95 CE: -34V        Library Hit 100
                                      2:192.10>132.10 CE: -32V                        105
                                      3:192.10>105.15 CE: -41V   2.5
                                      4:192.10>65.10 CE: -48V           65
                                      5:192.10>90.15 CE: -42V
                                                                                 90
                                      6:192.10>92.15 CE: -36V                             117
                                      7:192.10>117.15 CE: -33V
                                      8:192.10>78.15 CE: -55V                78
                                      9:192.10>133.10 CE: -32V   0.0
                                      10:192.10>51.10 CE: -60V             75.0     100.0    125.0    150.0 m/z
                                      11:192.10>106.20 CE: -42V   (Signal intensity 1e7)
                                      12:192.10>78.90 CE: -50V
                                                                                                          160
                                                                      Compound Name Carbendazim  132
                                                                 1.0  Concentration 0.050 mg/kg
                                                                      Library Hit 100
                                                                                      105
                 By applying a range of collision energies to carbendazim
            12 precursor-fragment ions are generated. MRM 192.10>159.95
            was used in generating sensitive and robust quantitation whilst   0.5  65
            the product ion spectrum using all 12 fragment ions was used in      90
                        confirming peak identification.                                   117
                                                                             78
                                                                 0.0
                                                                           75.0     100.0    125.0    150.0 m/z
              Peak Area                                           (Signal intensity 1e7)
                       Compound Name Carbendazim                                                132       160
                 3.5                                                  Compound Name Carbendazim
                       Linear regression curve No weighting      1.5
                       Regression  R² = 0.9993576                     Concentration 0.200 mg/kg
                                                                      Library Hit 98  105
                 3.0
                                                                 1.0
                                                                        65
                 2.5                                                             90
                                                                 0.5
                                                                                          117
                 2.0                                                         78
                                                                 0.0
                                                                           75.0     100.0    125.0    150.0 m/z
                 1.5

                                                                      MRM Product ion spectrum data for carbendazim in 3
                 1.0
                                                                calibration levels (0.010-0.200mg/kg) spiked into a food matrix
                                                                    was compared with an authentic library spectrum of
                 0.5                                             carbendazim. In all library searches the similarity score was
                                                                greater than 99 indicating a very high confidence in compound
                                                                             verification and reporting.
                 0.0
                    0       0.05    0.10     0.15    0.20
                              Concentration (mg/kg)

                  Calibration curve for carbendazim using the optimized
            quantitation ion transition (MRM 192.10>159.95). The response
             was linear for all calibration and QC samples. All 12 fragment
               ions were above a signal to noise ratio of 10 even at the
                        reporting level of 0.010mg/kg.
   25   26   27   28   29   30   31   32   33   34   35