Page 19 - Application Notebook - PFAS Analysis
P. 19

Application   No. C184
    News


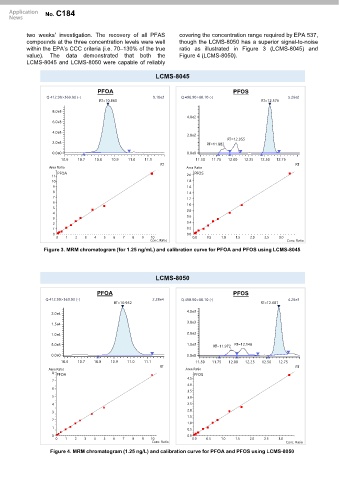
          two weeks’ investigation. The recovery of all PFAS    covering the concentration range required by EPA 537,
          compounds at the three concentration levels were well  though the LCMS-8050 has a superior signal-to-noise
          within the EPA’s CCC criteria (i.e. 70–130% of the true  ratio as illustrated in Figure 3 (LCMS-8045) and
          value).  The  data  demonstrated   that  both  the    Figure 4 (LCMS-8050).
          LCMS-8045 and LCMS-8050 were capable of reliably

                                                        LCMS-8045

                                   PFOA                                            PFOS
                 Q 412.90>369.00 (-)                   9.10e3    Q 498.90>80.10 (-)                   5.26e2
                                    RT=10.860                                                RT=12.576
                   8.0e3
                                                                   4.0e2
                   6.0e3

                   4.0e3
                                                                   2.0e2
                                                                                 RT=12.055
                   2.0e3
                                                                          RT=11.882
                   0.0e0                                           0.0e0
                      10.6  10.7  10.8  10.9  11.0  11.1              11.50  11.75  12.00  12.25  12.50  12.75
                                                         RT                                              RT
                  Area Ratio                                       Area Ratio
                     PFOA                                            PFOS
                   11                                              2.0
                   10                                              1.8
                    9                                              1.6
                    8                                              1.4
                    7
                                                                   1.2
                    6
                                                                   1.0
                    5
                                                                   0.8
                    4
                                                                   0.6
                    3
                                                                   0.4
                    2
                    1                                              0.2
                    0                                              0.0
                     0  1  2   3  4  5   6  7  8   9  10             0.0  0.5  1.0  1.5  2.0  2.5  3.0
                                                      Conc. Ratio                                     Conc. Ratio
                Figure 3. MRM chromatogram (for 1.25 ng/mL) and calibration curve for PFOA and PFOS using LCMS-8045
                                                        LCMS-8050

                                   PFOA                                            PFOS
                 Q 412.90>369.00 (-)                   2.28e4    Q 498.90>80.10 (-)                   4.29e3
                                         RT=10.952                                           RT=12.687
                                                                   4.0e3
                   2.0e4
                                                                   3.0e3
                   1.5e4
                   1.0e4                                           2.0e3
                   5.0e3                                           1.0e3    RT=11.972  RT=12.148

                   0.0e0                                           0.0e0
                      10.6  10.7  10.8  10.9  11.0  11.1              11.50  11.75  12.00  12.25  12.50  12.75
                                                         RT                                              RT
                  Area Ratio                                      Area Ratio
                   8
                     PFOA                                            PFOS
                                                                   4.5
                   7
                                                                   4.0
                   6
                                                                   3.5
                   5                                               3.0
                   4                                               2.5
                                                                   2.0
                   3
                                                                   1.5
                   2
                                                                   1.0
                   1
                                                                   0.5
                   0                                               0.0
                     0  1  2   3  4  5   6  7   8  9  10             0.0  0.5  1.0  1.5  2.0  2.5  3.0
                                                      Conc. Ratio                                    Conc. Ratio
                   Figure 4. MRM chromatogram (1.25 ng/L) and calibration curve for PFOA and PFOS using LCMS-8050
   14   15   16   17   18   19   20   21   22   23   24