Page 18 - Application Notebook - PFAS Analysis
P. 18

Application   No. C184
    News


          Since PFAS is ubiquitously present on laboratory    Q 398.90>80.10 (-)     RT=9.654               5.71e4
          equipment such as tubing and HPLC systems, it is      100.00
          impossible to completely eliminate PFAS from LC
          mobile phases even if LCMS-grade reagent solvents
          have been used. This necessitates the use of a solvent
          delay column for high-sensitivity analysis. A small C18
          column that have higher retention of PFAS than the        %
          analytical column is placed directly upstream of
          autosampler to trap all PFAS contained in the mobile
          phase. During chromatographic elution, the analytical
          column gives sample-derived PFAS peaks first,
          separated from secondary peaks derived from mobile
          phase contamination trapped on the delay column.        0.00
                                                                             9.4     9.6      9.8     10.0
                                                                                                                RT
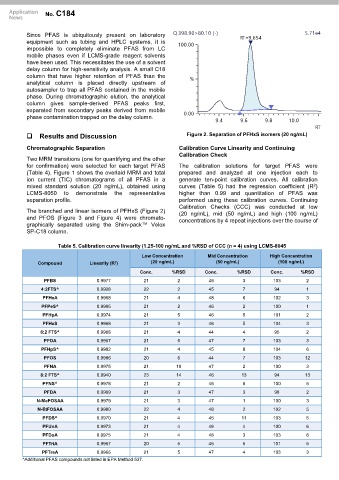
              Results and Discussion                              Figure 2. Separation of PFHxS isomers (20 ng/mL)

          Chromatographic Separation                            Calibration Curve Linearity and Continuing
                                                                Calibration Check
          Two MRM transitions (one for quantifying and the other
          for confirmation) were selected for each target PFAS  The calibration solutions for target PFAS were
          (Table 4). Figure 1 shows the overlaid MRM and total  prepared and analyzed at one injection each to
          ion current (TIC) chromatograms of all PFAS in a      generate ten-point calibration curves. All calibration
                                                                                                               2
          mixed standard solution (20 ng/mL), obtained using    curves (Table 5) had the regression coefficient (R )
          LCMS-8050     to  demonstrate  the  representative    higher than 0.99 and quantitation of PFAS was
          separation profile.                                   performed using these calibration curves. Continuing
                                                                Calibration Checks (CCC) was conducted at low
          The branched and linear isomers of PFHxS (Figure 2)   (20 ng/mL), mid (50 ng/mL) and high (100 ng/mL)
          and PFOS (Figure 3 and Figure 4) were chromato-       concentrations by 4 repeat injections over the course of
          graphically separated using the Shim-pack™ Velox
          SP-C18 column.

                     Table 5. Calibration curve linearity (1.25-100 ng/mL and %RSD of CCC (n = 4) using LCMS-8045
                                                   Low Concentration      Mid Concentration     High Concentration
                                         2
              Compound           Linearity (R )       (20 ng/mL)             (50 ng/mL)            (100 ng/mL)
                                                  Conc.      %RSD        Conc.      %RSD        Conc.      %RSD
                PFBS               0.9977           21         2          46          3          103         2
               4:2FTS^             0.9928           22         2          45          7          94          1
                PFHxA              0.9968           21         4          48          6          102         3
                PFPeS^             0.9985           21         2          46          2          100         1
                PFHpA              0.9974           21         5          46          5          101         2
                PFHxS              0.9968           21         3          46          5          104         3
               6:2 FTS^            0.9968           21         4          44          4          95          2
                PFOA               0.9967           21         5          47          7          103         3
               PFHpS^              0.9982           21         4          45          8          104         6
                PFOS               0.9986           20         6          44          7          103        12
                PFNA               0.9975           21         10         47          2          100         3
               8:2 FTS^            0.9940           23         14         46          13         94         13
                PFNS^              0.9978           21         2          46          6          100         5
                PFDA               0.9969           21         3          47          3          98          2
              N-MeFOSAA            0.9979           21         3          47          1          100         3
              N-EtFOSAA            0.9980           22         4          48          2          102         5
                PFDS^              0.9970           21         4          45          11         103         5
                PFUnA              0.9973          21          4          48          4          100         6
                PFDoA              0.9975          21          4          48          3          103         6
                PFTriA             0.9967          20          5          45          5          101         5
                PFTreA             0.9966          21          5          47          4          103         3
         ^Additional PFAS compounds not listed in EPA Method 537.
   13   14   15   16   17   18   19   20   21   22   23