
Page 9 - LC-SFC_Pharma_Brochure
P. 9
4-5. Step 2: Optimization of Gradient Conditions
After establishing the highest evaluated mobile phase and final concentration (3 types, including 40%, 65%, 90%),
(combination of phosphate buffer solution and acetonitrile) and we investigated 5-minute gradient programs from initial to
column (Kinetex XB-C18), next we focused on determining the final concentration. The other conditions were the same as
optimum gradient conditions. Based on a total of 9 combina- those shown in Table 1. The analytical conditions are shown in
tions of initial concentration (3 types, including 5%, 10%, 15%) Table 3.
Table 3 Step 2 Analytical Conditions
Mobile phase :(A) Sodium phosphate buffer solution (pH 2.6)
(B) Acetonitrile
Column :Kinetex XB-C18 (50 mmL. × 3.0 mmI.D., 2.6 µm)
Time program :(1) B Conc. 5% (0 min) 40% (5.01−7 min) 5% (7.01−9 min)
(2) B Conc. 5% (0 min) 65% (5.01−7 min) 5% (7.01−9 min)
(3) B Conc. 5% (0 min) 90% (5.01−7 min) 5% (7.01−9 min)
(4) B Conc. 10% (0 min) 40% (5.01−7 min) 10% (7.01−9 min)
(5) B Conc. 10% (0 min) 65% (5.01−7 min) 10% (7.01−9 min)
(6) B Conc. 10% (0 min) 90% (5.01−7 min) 10% (7.01−9 min)
(7) B Conc. 15% (0 min) 40% (5.01−7 min) 15% (7.01−9 min)
(8) B Conc. 15% (0 min) 65% (5.01−7 min) 15% (7.01−9 min)
(9) B Conc. 15% (0 min) 90% (5.01−7 min) 15% (7.01−9 min)
Flow rate :1.0 mL/min
Injection volume :5 µL
Column temperature :40°C
Detection wavelength :260 nm (SPD-M20A)
4-6. Chromatogram Verification (Step 2)
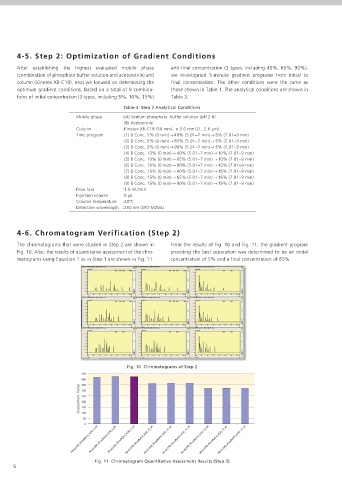
The chromatograms that were studied in Step 2 are shown in From the results of Fig. 10 and Fig. 11, the gradient program
Fig. 10. Also, the results of quantitative assessment of the chro- providing the best separation was determined to be an initial
matograms using Equation 1 as in Step 1 are shown in Fig. 11. concentration of 5% and a final concentration of 65%.
Fig. 10 Chromatograms of Step 2
450
400
350
Assessment Value 300
250
200
150
100
50
0
Fig. 11 Chromatogram Quantitative Assessment Results (Step 2)
5