
Page 7 - LC-SFC_Pharma_Brochure
P. 7
4-1. Step 1: Scouting for Mobile
Phases and Column Equation 1
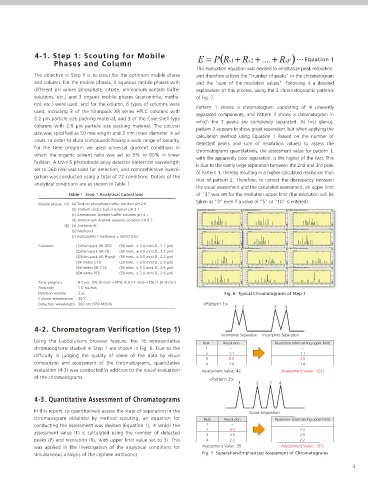
This evaluation equation was devised to emphasize peak resolution,
The objective in Step 1 is to scout for the optimum mobile phase and therefore utilizes the "number of peaks" in the chromatogram
and column. For the mobile phases, 4 aqueous mobile phases with and the "sum of the resolution values". Following is a detailed
different pH values (phosphate, citrate, ammonium acetate buffer explanation of this process, using the 2 chromatographic patterns
solutions, etc.) and 3 organic mobile phases (acetonitrile, metha- of Fig. 7.
nol, etc.) were used, and for the column, 6 types of columns were
Pattern 1 shows a chromatogram consisting of 4 unevenly
used, including 3 of the Shimpack XR series HPLC columns with
separated components, and Pattern 2 shows a chromatogram in
2.2 µm particle size packing material, and 3 of the Core-shell type
which the 2 peaks are completely separated. At first glance,
columns with 2.6 µm particle size packing material. The column
pattern 2 appears to show good separation, but when applying the
size was specified as 50 mm length and 3 mm inner diameter in all
calculation method using Equation 1 (based on the number of
cases. In order to elute compounds having a wide range of polarity,
detected peaks and sum of resolution values) to assess the
for the time program we used universal gradient conditions in
chromatograms quantitatively, the assessment value for pattern 1,
which the organic solvent ratio was set to 5% to 90% in linear
with the apparently poor separation, is the higher of the two. This
fashion. A UV-VIS photodiode array detector (detection wavelength
is due to the overly large separation between the 2nd and 3rd peak
set to 260 nm) was used for detection, and comprehensive investi-
of Pattern 1, thereby resulting in a higher calculated resolution than
gation was conducted using a total of 72 conditions. Details of the
that of pattern 2. Therefore, to correct the discrepancy between
analytical conditions are as shown in Table 1.
the visual assessment and the calculated assessment, an upper limit
Table 1 Step 1 Analytical Conditions of "3" was set for the resolution upper limit (the resolution will be
taken as "3" even if a value of "5" or "10" is entered).
Mobile phases: (A) (a) Sodium phosphate buffer solution pH 2.6
(b) Sodium citrate buffer solution pH 3.1
(c) Ammonium Acetate buffer solution pH 4.7
(d) Ammonium Acetate aqueous solution pH 6.7
(B) (a) Acetonitrile
(b) Methanol
(c) Acetonitrile / methanol = 50/50 (v/v)
Columns: (1)Shim-pack XR-ODS (50 mmL. × 3.0 mmI.D.ɼ2.2 µm)
(2)Shim-pack XR-C8 (50 mmL. × 3.0 mmI.D.ɼ2.2 µm)
(3)Shim-pack XR-Phenyl (50 mmL. × 3.0 mmI.D.ɼ2.2 µm)
(4)Kinetex C18 (50 mmL. × 3.0 mmI.D.ɼ2.6 µm)
(5)Kinetex XB-C18 ɹ(50 mmL. × 3.0 mmI.D.ɼ2.6 µm)
(6)Kinetex PFP (50 mmL. × 3.0 mmI.D.ɼ2.6 µm)
Time program : B Conc. 5% (0 min) 90% (5.01-7 min) 5% (7.01-9 min)
Flow rate : 1.0 mL/min
Injection volume : 5 µL Fig. 6 Typical Chromatograms of Step 1
Column temperature : 40°C
Detection wavelength : 260 nm (SPD-M20A) <Pattern 1>
1 2 3 4
4-2. Chromatogram Verification (Step 1)
Incomplete Separation Incomplete Separation
Using the LabSolutions browser feature, the 16 representative
Peak Resolution Resolution (after setting upper limit)
chromatograms studied in Step 1 are shown in Fig. 6. Due to the 1 − −
difficulty in judging the quality of some of the data by visual 2 1.1 1.1
3 8.0 3.0
comparison and assessment of the chromatograms, quantitative 4 1.4 1.4
evaluation (4-3) was conducted in addition to the visual evaluation Assessment Value 42 Assessment Value (22)
of the chromatograms.
<Pattern 2>
1 2 3 4
4-3. Quantitative Assessment of Chromatograms
In this report, to quantitatively assess the state of separation in the Good Separation
chromatogram obtained by method scouting, an equation for Peak Resolution Resolution (after setting upper limit)
conducting the assessment was devised (Equation 1), in which the 1 − −
2 4.0 3.0
assessment value (E) is calculated using the number of detected
3 2.5 2.5
peaks (P) and resolution (Rs, with upper limit value set to 3). This 4 2.2 2.2
was applied in the investigation of the analytical conditions for Assessment Value 35 Assessment Value (31)
simultaneous analysis of the cephem antibiotics. Fig. 7 Separation-Emphasized Assessment of Chromatograms
3