Page 47 - LC-SFC_Pharma_Brochure
P. 47

C191-E042


            4. Data Analysis Using LabSolutions                  5. Conclusion
                Data Analysis Using LabSolutions
                                                                 5. Conclusion
            4.
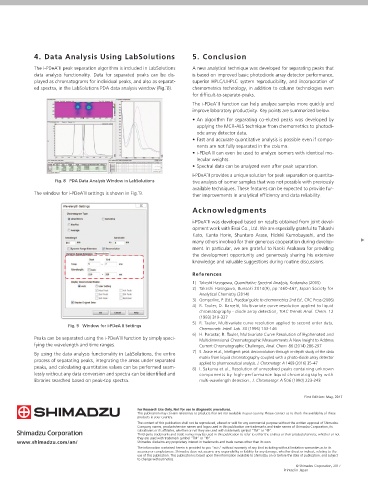
            The i-PDeA˜II peak separation algorithm is included in LabSolutions   A new analytical technique was developed for separating peaks that               New Data Processing Method for
            data  analysis  functionality.  Data  for  separated  peaks  can  be  dis-  is based on improved basic photodiode array detector performance,
            played as chromatograms for individual peaks, and also as separat-  superior  HPLC/UHPLC  system  reproducibility,  and  incorporation  of   Technical  Photodiode Array Detectors
            ed spectra, in the LabSolutions PDA data analysis window (Fig.˜8).  chemometrics technology, in addition to column technologies even
                                                                 for difficult-to-separate-peaks.                                     Report                       Principle and Overview of Intelligent Peak Deconvolution
                                                                 The i-PDeA˜II function can help analyze samples more quickly and                                  Analysis (i-PDeA II)
                                                                 improve laboratory productivity. Key points are summarized below.
                                                                 • An algorithm for separating co-eluted peaks was developed by                                    Toshinobu Yanagisawa 1
                                                                  applying the MCR-ALS technique from chemometrics to photodi-
                                                                  ode array detector data.
                                                                 • Fast and accurate quantitative analysis is possible even if compo-
                                                                  nents are not fully separated in the column.                        Abstract:
                                                                 • i-PDeA II can even be used to analyze isomers with identical mo-   An i-PDeA II (Intelligent Peak Deconvolution Analysis II) data analysis technique was developed for extracting target peaks from unsepa-
                                                                  lecular weights.                                                    rated  peaks  by  analyzing  photodiode  array  (PDA)  detector  data  using  the  chemometrics  multivariate  curve  resolution  alternating  least
                                                                 • Spectral data can be analyzed even after peak separation.          squares (MCR-ALS) technique. The i-PDeA˜ II function can separate peaks for multiple components in absorption spectra and chromato-
                                                                 i-PDeA˜II provides a unique solution for peak separation or quantita-  grams by simply specifying the wavelength and time ranges. The i-PDeA˜II function can be used to identify spectra and quantitate peaks
                   Fig. 8  PDA Data Analysis Window in LabSolutions  tive analysis of isomer samples that was not possible with previously   after separation of individual components, even for difÿcult-to-separate  peaks for which a standard sample cannot be prepared. Further-
                                                                 available techniques. These features can be expected to provide fur-  more, because i-PDeA˜II separates peaks based only on differences in spectral shape, it can also be used to separate and quantitate peaks
            The window for i-PDeA˜II settings is shown in Fig.˜9.  ther improvements in analytical efficiency and data reliability.   for co-eluted isomers. This report explains the principle used by the i-PDeA˜II technique to separate peaks, describes an example of using
                                                                                                                                      i-PDeA˜II to analyze a sample with isomers of three components, and evaluates the spectral identiÿcation and quantitation performance.

                                                                 Acknowledgments                                                      Keywords: Photodiode array detector, chemometrics, MCR-ALS, and LabSolutions
                                                                 Acknowledgments
                                                                 i-PDeA˜II was developed based on results obtained from joint devel-
                                                                 opment work with Eisai Co., Ltd. We are especially grateful to Takashi
                                                                 Kato,  Kanta  Horie,  Shuntaro  Arase,  Hideki  Kumobayashi,  and  the
                                                                                                                                      1.
                                                                                                                                          Fundamental Theor
                                                                                                                                                                  etical Basis
                                                                 many others involved for their generous cooperation during develop-  1. Fundamental Theoretical Basis                     where,
                                                                                                                                          for Peak Deconvolution Algorithm
                                                                 ment. In particular, we are grateful to Naoki Asakawa for providing        for Peak Deconvolution Algorithm                    d(t 1 ,λ 1 )  ...  d(t 1 ,λ m )  α 1  β 1  γ 1
                                                                 the development opportunity and generously sharing his extensive                                                           D =   …  ...  …   ,  c 1  =  …  , c 2  =  …  , c 3  =  …
                                                                 knowledge and valuable suggestions during routine discussions.       1-1.  Modeling PDA Detector Data                          d(t n ,λ 1 )  ...  d(t n ,λ m )  α n  β n  γ n
                                                                                                                                                                                                α 1 β 1 γ 1   s 1 (λ 1 )  ...  s 1 (λ m )
                                                                                                                                      Given peak profiles and spectra for each component in a three-com-  C =  ,  S  =  s 2 (λ 1 )  ...  s 2 (λ m )
                                                                                                                                                                                                           T
                                                                 References                                                                                                                      …  …  …
                                                                                                                                      ponent mixture, c1(t), s1(λ), c2(t), s2(λ), c3(t), and s3(λ), then measure-  α n β n γ n  s 3 (λ 1 )  ...  s 3 (λ m )
                                                                 1) Takeshi Hasegawa, Quantitative Spectral Analysis, Kodansha (2005)  ment data in an ideal system d(t,λ) can be described by the following
                                                                 2) Takeshi Hasegawa, Bunseki 2014(9), pp.˜460-467, Japan Society for                                                       Measurement data   Peak pro les    Spectra
                                                                   Analytical Chemistry (2014)                                        expression.                                            d(t, λ)                             s2
                                                                 3) Gemperline, P. (Ed.), Practical guide to chemometrics 2nd Ed., CRC Press (2006)  d(t,λ) = c 1 (t)s 1 (λ) + c 2 (t)s 2 (λ) + c 3 (t)s 3 (λ)
                                                                 4) R. Tauler, D. Barceló, Multivariate curve resolution applied to liquid   Then spectra d(ti,λ) measured as a function of time ti can be expressed            s3
                                                                   chromatography - diode array detection, TrAC Trends Anal. Chem. 12   as follows:                                                                          s1
                                                                   (1993) 319-327                                                                                                                               c1 c2 c3
                                                                 5) R. Tauler, Multivariate curve resolution applied to second order data,   d(t i ,λ) = c 1 (t i )s 1 (λ) + c 2 (t i )s 2 (λ) + c 3 (t i )s 3 (λ)  Wavelength
                        Fig. 9  Window for i-PDeA II Settings                                                                                                                                      Retention time
                                                                   Chemometr. Intell. Lab. 30 (1995) 133-146                          Assuming  spectral  components  are  vectors  with  discrete  values  λj   Retention time  Wavelength
                                                                 6) H. Parastar, R. Tauler, Multivariate Curve Resolution of Hyphenated and                                                                          Deconvolute to individual component
            Peaks can be separated using the i-PDeA˜II function by simply speci-  Multidimensional Chromatographic Measurements:A New Insight to Address   (where j˜=˜1 to m), then spectra can be described as follows:
            fying the wavelength and time ranges.                  Current Chromatographic Challenges, Anal. Chem. 86 (2014) 286-297    T    T   T    T         s 1 T T                     c1(t)s1(λ)      c2(t)s2(λ)      c3(t)s3(λ)
            By using the data analysis functionality in LabSolutions, the entire   7) S. Arase et al., Intelligent peak deconvolution through in-depth study of the data   d i  = α i s 1  + β i s 2  + γ i s 3  = (α i   β i   γ i )  s 2 T
            process of separating peaks, integrating the areas under separated   matrix from liquid chromatography coupled with a photo-diode array detector   where,  s 3
                                                                   applied to pharmaceutical analysis, J. Chromatogr. A 1469 (2016) 35–47
            peaks, and calculating quantitative values can be performed seam-  8) I. Sakuma et al., Resolution of unresolved peaks containing unknown   d i  = (d(t i ,λ 1 )  ...  d(t i ,λ m ))
                                                                                                                                        T
            lessly without any data conversion and spectra can be identified and   components by high-performance liquid chromatography with   α i  = c 1 (t i ), β i  = c 2 (t i ), γ i  = c 3 (t i )  Wavelength  Retention time  Wavelength  Retention time  Wavelength  Retention time
            libraries searched based on peak-top spectra.          multi-wavelength detection., J. Chromatogr. A 506 (1990) 223-243
                                                                                                                                                        T
                                                                                                                                        T
                                                                                                                                                                       T
                                                                                                                                       s 1  = (s 1 (λ 1 )  ...  s 1 (λ m )), s 2  = (s 2 (λ 1 )  ...  s 2 (λ m )), s 3  = (s 3 (λ 1 )  ...  s 3 (λ m ))  Fig. 1  Measurement Data from Three-Component Mixture Sample
                                                                                                                                      By summarizing each spectrum measurement at time ti (where i˜=˜1
                                                                                                      First Edition: May, 2017                                                             The data can be expressed schematically as follows:
                                                                                                                                      to n), measurements can be expressed in matrix form, as follows:
                                                                                                                                         T             T
                                                                                                                                        d 1   α 1 β 1 γ 1  s 1
                                                                                                                                            =  …  …  …  s 2 T                             Meaurement spectrum 1         Component 1 pure spectrum
                                                                                                                                         …
                                                                                                                                         T             T                                         …        =   Component 1 profile  Component 2 profile  Component 3 profile  Component 2 pure spectrum
                                                                                                                                        d n   α n β n γ n  s 3
                                                                                                                                                                                          Meaurement spectrum n         Component 3 pure spectrum
                                                                                                                                      or by direct product (outer product), as follows:
                                                                                                                                             T   T    T
                                                                                                                                       D = c 1 s 1  + c 2 s 2  + c 3 s 3  Eq.˜(1)
                                                                                                                                      or alternatively                                     Considering  measurement  error,  noise,  and  unpredictable  factors,  and
                                                                                                                                                                                                                                        1), 2)
                                                                                                                                       D = CS T                Eq.˜(2)                     given a remainder R, the measurement data can be modeled as follows:
                                                                                                                                                                                            D = CS  + R
                                                                                                                                                                                                 T
                                                                                                                                                                                           This relational expression is valid for any number of components.
                                                                                                   © Shimadzu Corporation, 2017       1 Analytical & Measuring Instruments Division                                                            1
                                                                                               Printed in Japan
   42   43   44   45   46   47   48   49   50   51   52