Page 43 - LC-SFC_Pharma_Brochure
P. 43

3. Summary of i-PDeA Settings                        4. Conclusion

            The parameters for the i-PDeA function are set as part of the data   The excellent performance and reproducibility of the SPD-M30A
            processing method of the photodiode array detector. Once the   photodiode array detector and the Nexera X2 system make this
            analytical protocol is defined, it can be applied for routine analy-  new separation methodology possible. The i-PDeA function helps
            sis. The following is a brief summary of the i-PDeA parameters.  increase the speed of analysis and enhances laboratory produc-
                                                                 tivity. To summarize the key benefits:
            1.  The Savitzky-Golay method is used to determine the first deriv-
                                                                  Co-eluted peaks can be separated mathematically, using deriv-
              ative spectrum, from which a list of wavelengths where the 1 st
                                                                  ative spectrum chromatograms
              derivative value is zero is generated. Spline interpolation is ap-
                                                   st
              plied to calculate the wavelength closest to the 1  derivative   Poorly resolved peaks are processed and visualized as pure
              zero wavelengths, and the results are displayed in a table.  peaks with no contribution from co-eluting components
                                                                  Impurity peaks hidden by, or even in, the target peak can be
                                                                  detected
                                                                  Fast and accurate quantitative analysis is possible, even without
                                                                  complete chromatographic separation
                                                                  Simple post-run analysis procedure
              i-PDeA most effectively resolves co-eluted peaks when the peak
                                                                 The i-PDeA function provides a new solution, which is useful for
              height in the derivative spectrum chromatogram for one com-
                                                                 identification and quantitation of impurities. The use of this fea-
                              st
              ponent, taken at a 1  derivative zero wavelength of another
                                                                 ture is expected to increase laboratory efficiency and produce
              component, is sufficiently large. If the shape of the spectra of
                                                                 more reliable analytical data.
              two components is very similar, i-PDeA cannot be applied.
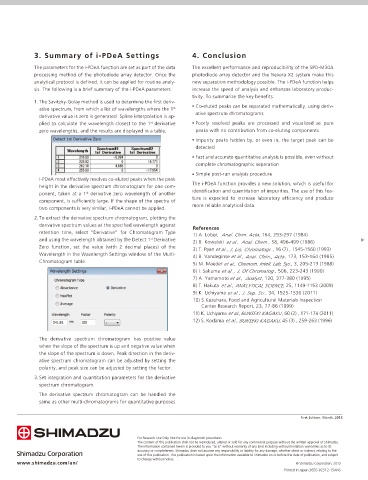
            2.  To extract the derivative spectrum chromatogram, plotting the
              derivative spectrum values at the specified wavelength against
                                                                 References
              retention time, select “Derivative” for Chromatogram Type
                                                                          Anal. Chim. Acta
                                                                 1) A. Lober,                           , 164, 293-297 (1984)
              and using the wavelength obtained by the Detect 1  Derivative
                                                   st
                                                                 2) B. Kowalski        .,                   ., 58, 496-499 (1986)
                                                                            et al
                                                                                 Anal. Chem
              Zero function, set the value (with 2 decimal places) of the
                                                                        et al
                                                                 3) T. Ryan        .,                               ., 16 (7) , 1545-1560 (1993)
                                                                             J. Liq. Chromatogr
              Wavelength in the Wavelength Settings window of the Multi-
                                                                                  Anal. Chim., Acta
                                                                 4) B. Vandeginse       .,                            , 173, 153-164 (1985)
                                                                              et al
              Chromatogram table.
                                                                 5) M. Maeder       .,                                     ., 3, 205-213 (1988)
                                                                           et al Chemom. Intell. Lab. Sys
                                                                 6) I. Sakuma        .,                          ., 506, 223-243 (1990)
                                                                          et al
                                                                                J. Of Chromatog
                                                                                  Analyst
                                                                             et al
                               ղ૾౓ෆ଍                             7) A. Yamamoto       .,             , 120, 377-380 (1995)
                                                                          et al ANALYTICAL SCIENCE
                                                                 8) T. Hakuta         .,                                                                        , 25, 1149-1153 (2009)
                                                                                 J. Sep. Sci
                                                                 9) K. Uchiyama        .,                ., 34, 1525-1530 (2011)
                                                                            et al
                                                                 10) S.Kazuhara, Food and Agricultural Materials Inspection
                                                                       Center Research Report, 23, 77-86 (1999)
                                                                             et al BUNSEKI KAGAKU
                                                                 11) K. Uchiyama        .,                               , 60 (2) , 171-174 (2011)
                                                                            et al BUNSEKI KAGAKU
                                                                 12) S. Kodama        .,                              , 45 (3) , 259-263 (1996)
              The derivative spectrum chromatogram has positive value
              when the slope of the spectrum is up and negative value when
              the slope of the spectrum is down. Peak direction in the deriv-
              ative spectrum chromatogram can be adjusted by setting the
              polarity, and peak size can be adjusted by setting the factor.
            3.  Set integration and quantitation parameters for the derivative
              spectrum chromatogram.
              The derivative spectrum chromatogram can be handled the
              same as other multi-chromatograms for quantitative purposes.
                                                                                                     First Edition: March, 2013
                                               For Research Use Only. Not for use in diagnostic procedures.
                                               The content of this publication shall not be reproduced, altered or sold for any commercial purpose without the written approval of Shimadzu.
                                               The information contained herein is provided to you "as is" without warranty of any kind including without limitation warranties as to its
                                               accuracy or completeness. Shimadzu does not assume any responsibility or liability for any damage, whether direct or indirect, relating to the
                                               use of this publication. This publication is based upon the information available to Shimadzu on or before the date of publication, and subject
                                               to change without notice.
       www.shimadzu.com/an/                                                                        © Shimadzu Corporation, 2013
                                                                                               Printed in Japan 3655-02312-15ANS
   38   39   40   41   42   43   44   45   46   47   48