
Page 46 - LC-SFC_Pharma_Brochure
P. 46
1-2. Solutions Using MCR-ALS Technique 400 µg/mL concentration standard samples of the pure isomers were 300 o- / p- / m- = 100 / 1 / 100 10
prepared by dissolving pure o-MAP, m-MAP, and p-MAP in 30˜vol%
The MCR-ALS technique estimates the peak profile or the spectrum with methanol-water solution and then data was acquired using the fol-
the closest fit to measurement data by repeatedly approximating C (peak lowing analytical conditions. 200
profiles) or S (spectra) in equation (2) using least squares approximation. Intensity (mAU) 5
The following is the typical method for determining solutions by the Analytical Conditions
MCR-ALS technique. 3), 4), 5), 6) 100
HPLC System : Shimadzu LC-2030C 3D
Step˜1 Specify the number of components in measurement data D. Mobile Phase : Methanol 30 %/water 70 %
Step˜2 Calculate initial estimate (for example, by specifying the initial Column Type : Shimadzu Shim-pack XR-ODS III C18 0 0
value for C). (3.0 × 50 mm, 2.2˜µm) 5.0 5.5 6.0 6.5 7.0 5.0 5.5 6.0 6.5 7.0
T
Step˜3 Using the estimate of C, calculate the S matrix under appro- Mobile Phase Flowrate : 1.0˜mL/min Retention time (min) Retention time (min)
: 40˜°C
Oven Temperature
priately chosen constraints. Sampling : 240˜msec
T
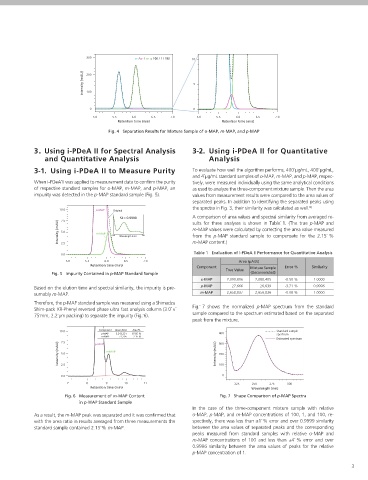
Step˜4 Using the estimate of S , calculate the C matrix under appro- Slit Width : 1.2 nm Fig. 4 Separation Results for Mixture Sample of o-MAP, m-MAP, and p-MAP
priately chosen constraints. Time Constant : 480˜msec
T
Step˜5 From the product of C and S found in the above steps of an iter- Sampling Wavelength Range : 190˜nm to 400˜nm
ative cycle, calculate an estimate of the original data matrix, D. Sample Injection Volume : 1.5˜µL 3. Using i-PDeA II for Spectral Analysis 3-2. Using i-PDeA II for Quantitative
Step 6 Repeat steps 3, 4, and 5 until convergence is achieved. and Quantitative Analysis Analysis
Equation (2) generally does not give a unique solution. Therefore, to deter- The methylacetophenone isomers eluted in the order o-MAP, 3-1. Using i-PDeA II to Measure Purity To evaluate how well the algorithm performs, 400˜µg/mL, 400˜µg/mL,
mine the optimal solution, constraints must be specified based on problem p-MAP, and m-MAP respectively, where the similarity between re- and 4˜µg/mL standard samples of o-MAP, m-MAP, and p-MAP, respec-
characteristics. Consequently, by specifying appropriate constraints, spective components in spectra obtained from peak tops for each When i-PDeA˜II was applied to measurement data to confirm the purity tively, were measured individually using the same analytical conditions
MCR-ALS can provide valid solutions even without prior information. isomer in measurement data was 0.8410 for o-MAP/p-MAP, 0.9123 of respective standard samples for o-MAP, m-MAP, and p-MAP, an as used to analyze the three-component mixture sample. Then the area
for p-MAP/m-MAP, and 0.9809 for o-MAP/m-MAP (Fig. 3). impurity was detected in the p-MAP standard sample (Fig. 5). values from measurement results were compared to the area values of
1-3. i-PDeA II Peak Separation Algorithm 350 separated peaks. In addition to identifying the separated peaks using
p-MAP m-MAP 10.0 p-MAP the spectra in Fig. 3, their similarity was calculated as well. 8)
If equation˜ (1) is expanded for N components, the measurement Original
300 A comparison of area values and spectral similarity from averaged re-
signal D can be expressed by the following equation. 7.5 SI = 0.9990 sults for three analyses is shown in Table˜ 1. (The true p-MAP and
T T ... T 250
D = c 1 s 1 + c 2 s 2 + + c N s N m-MAP values were calculated by correcting the area value measured
o-MAP Intensity (mAU) 5.0
This algorithm determines a solution by minimizing the following 200 m-MAP 210 Wavelength (nm) 320 from the p-MAP standard sample to compensate for the 2.15˜ %
squared errors, with the chromatogram vector ck substituted by the 2.5 m-MAP content.)
chromatogram model function fk. 7) Intensity (mAU) 150 Table 1 Evaluation of i-PDeA II Performance for Quantitative Analysis
E = |D − Σf k s k | T 2 (k = 1, 2, …, N) 0.0
100 5.0 5.5 6.0 6.5 7.0 Area (µAUs)
In this case, a bidirectional exponentially modified Gaussian (BEMG) Retention time (min) Component Mixture Sample Error % Similarity
function is used as the chromatogram model function. BEMG is the 50 Fig. 5 Impurity Contained in p-MAP Standard Sample True Value (Deconvoluted)
reciprocal of the delay time component of the exponentially modified o-MAP 2,090,806 2,080,405 -0.50 % 1.0000
Gaussian (EMG) function, as defined by the following equations. 0 Based on the elution time and spectral similarity, the impurity is pre- p-MAP 27,666 26,639 -3.71 % 0.9996
0 m-MAP 2,658,837 2,656,836 -0.08 % 1.0000
ax .
6.0
bemg(t,a,b) = e emg(t − x,b)dx 5.0 5.5 Retention time (min) 6.5 7.0 sumably m-MAP.
−∞ Therefore, the p-MAP standard sample was measured using a Shimadzu
∞ Fig.˜ 7 shows the normalized p-MAP spectrum from the standard
−bx .
emg(t,b) = e exp(−(t − x) )dx 400 p-MAP Similarity Shim-pack XR-Phenyl reversed phase ultra fast analysis column (3.0˜×˜
2
(o- / p-) = 0.8410
0 (p- / m-) = 0.9123 75˜mm, 2.2˜µm packing) to separate the impurity (Fig.˜6). sample compared to the spectrum estimated based on the separated
This algorithm applies the MCR-ALS technique by using an estimated 300 m-MAP (o- / m-) = 0.9809 peak from the mixture.
value as the initial value and the BEMG model function as the chromato- Intensity (mAU) 200 Component Area (˛AUs) Area % Standard sample
gram constraint. Since the number of components after separation is un- o-MAP 10.0 p-MAP 3,243,251 97.85 % 400 spectrum
71,205
m-MAP
2.15 %
known, the initial condition starts with a single component and then suc- 100 7.5 300 Estimated spectrum
cessively adds components as the presence of unseparated peaks are de- p-MAP
termined in the residual signal to determine the optimal solution. 0 Intensity (mAU) 5.0 m-MAP Intensity (mAU) 200
225 250 275 300
Wavelength (nm) 2.5 100
2. Example of Using the Algorithm for Fig. 3 Measurement Results for Standard Samples of
a Three-Component Mixture Sample o-MAP, m-MAP, and p-MAP 0.0 0
7 8 9 10 11 225 250 275 300
The following describes an example of using the algorithm for a mixture A mixture solution prepared by mixing o-MAP, m-MAP, and p-MAP Retention time (min) Wavelength (nm)
of the positional isomers o-methyl acetophenone (o-MAP), m-methyl standard samples to 400˜µg/mL, 400˜µg/mL, and 4˜µg/mL concentra- Fig. 6 Measurement of m-MAP Content Fig. 7 Shape Comparison of p-MAP Spectra
acetophenone (m-MAP), and p-methyl acetophenone (p-MAP), shown tions, respectively, and then data was acquired using the same analyti- in p-MAP Standard Sample
in Fig. 2. cal conditions. Given the relative concentrations in the order of peak In the case of the three-component mixture sample with relative
O O O
elution (o-MAP/p-MAP/m-MAP =100/1/100), the peak for p-MAP As a result, the m-MAP peak was separated and it was confirmed that o-MAP, p-MAP, and m-MAP concentrations of 100, 1, and 100, re-
(relative concentration of 1) was obscured by the peaks for o-MAP and with the area ratio in results averaged from three measurements the spectively, there was less than ±1˜% error and over 0.9999 similarity
m-MAP (relative concentration of 100), which eluted before and after standard sample contained 2.15˜% m-MAP. between the area values of separated peaks and the corresponding
the p-MAP peak. Consequently, the presence of p-MAP could not be peaks measured from standard samples with relative o-MAP and
conÿrmed visually. However, when i-PDeA˜ II was used for measure- m-MAP concentrations of 100 and less than ±4˜ % error and over
o-methylacetophenone m-methylacetophenone p-methylacetophenone ment data from the time range from 5.0 to 7.0 minutes and wave- 0.9996 similarity between the area values of peaks for the relative
Fig. 2 Structure of Target Substances length range from 210 to 320˜nm, o-MAP, m-MAP, and p-MAP could p-MAP concentration of 1.
be separated into independent peaks, as shown in Fig.˜4.
2 3