
Page 41 - LC-SFC_Pharma_Brochure
P. 41
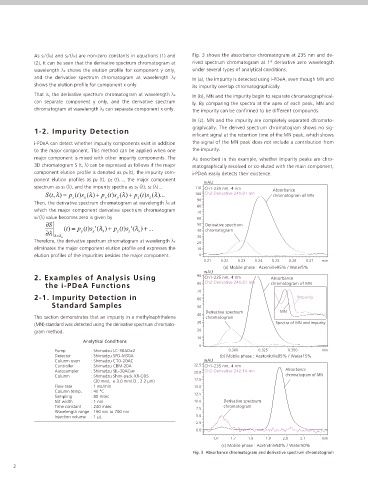
As sx‘(λy) and sy’(λx) are non-zero constants in equations (1) and   Fig. 3 shows the absorbance chromatogram at 235 nm and de-
                                                                                           st
            (2), it can be seen that the derivative spectrum chromatogram at   rived spectrum chromatogram at 1  derivative zero wavelength
            wavelength λx shows the elution profile for component y only,   under several types of analytical conditions.
            and the derivative spectrum chromatogram at wavelength  λy   In (a), the impurity is detected using i-PDeA, even though MN and
            shows the elution profile for component x only.      its impurity overlap chromatographically.
            That is, the derivative spectrum chromatogram at wavelength λx   In (b), MN and the impurity begin to separate chromatographical-
            can separate component y only, and the derivative spectrum   ly. By comparing the spectra at the apex of each peak, MN and
            chromatogram at wavelength λy can separate component x only.   the impurity can be confirmed to be different compounds.
                                                                 In (c), MN and the impurity are completely separated chromato-
                                                                 graphically. The derived spectrum chromatogram shows no sig-
            1-2. Impurity Detection
                                                                 nificant signal at the retention time of the MN peak, which shows
            i-PDeA can detect whether impurity components exist in addition   the signal of the MN peak does not include a contribution from
            to the major component. This method can be applied when one   the impurity.
            major component is mixed with other impurity components. The   As described in this example, whether impurity peaks are chro-
            3D chromatogram S (t, λ) can be expressed as follows if the major   matographically resolved or co-eluted with the main component,
            component elution profile is denoted as px (t), the impurity com-  i-PDeA easily detects their existence.
            ponent elution profiles as py (t), pz (t)…, the major component
                                                                     mAU
            spectrum as sx (λ), and the impurity spectra as sy (λ), sz (λ)…   110  Ch1-235 nm, 4 nm  Absorbance
                S  , (t  ) λ =  p x (t )s x (λ ) +  p y (t )s y (λ ) +  p z (t )s z (λ )...  100 Ch2-Derivative 241.81 nm  chromatogram of MN
                                                                  90
            Then, the derivative spectrum chromatogram at wavelength λx at
                                                                  80
            which the major component derivative spectrum chromatogram
                                                                  70
            sx'(λ) value becomes zero is given by                 60
                ∂S    (t ) = p  (t )s  ( ' λ  ) + p  (t )s  ( ' λ ) +  ...  50  Derivative spectrum
                ∂λ λ =λ     y   y  x    z   z  x                  40  chromatogram
                     x
            Therefore, the derivative spectrum chromatogram at wavelength λx   30
                                                                  20
            eliminates the major component elution profile and expresses the   10
            elution profiles of the impurities besides the major component.  0
                                                                     0.21  0.22  0.23  0.24  0.25  0.26  0.27  min
                                                                           (a) Mobile phase : Acetnirile95% / Water5%
                                                                     mAU
            2. Examples of Analysis Using                         90  Ch1-235 nm, 4 nm     Absorbance
                the i-PDeA Functions                              80  Ch2-Derivative 241.81 nm  chromatogram of MN
                                                                  70
            2-1. Impurity Detection in                            60                                Impurity
                   Standard Samples                               50
                                                                     Derivative spectrum      MN
                                                                  40
            This section demonstrates that an impurity in a methylnaphthalene   chromatogram
            (MN) standard was detected using the derivative spectrum chromato-  30          Spectra of MN and impurity
            gram method.                                          20
                                                                  10
                             Analytical Conditions
                                                                   0
                   Pump        : Shimadzu LC-30AD×2                          0.300     0.325    0.350       min
                   Detector    : Shimadzu SPD-M30A                        (b) Mobile phase : Acetonitrile85% / Water15%
                   Column oven  : Shimadzu CTO-20AC                  mAU
                   Controller  : Shimadzu CBM-20A                22.5  Ch1-235 nm, 4 nm
                   Autosampler  : Shimadzu SIL-30ACMP            20.0  Ch2-Derivative 242.14 nm  Absorbance
                   Column      : Shimadzu Shim-pack XR-ODS                                      chromatogram of MN
                                 (30 mmL. × 3.0 mmI.D., 2.2 µm)  17.5
                   Flow rate   : 1 mL/min                        15.0
                   Column temp.  : 40 °C
                                                                 12.5
                   Sampling    : 80 msec
                   Slit width  : 1 nm                            10.0      Derivative spectrum
                   Time constant  : 240 msec                      7.5      chromatogram
                   Wavelength range  : 190 nm to 700 nm
                   Injection volume  : 1 µL                       5.0
                                                                  2.5
                                                                  0.0
                                                                        1.6  1.7   1.8   1.9   2.0   2.1    min
                                                                          (c) Mobile phase : Acetnitrile50% / Water50%
                                                                 Fig. 3  Absorbance chromatogram and derivative spectrum chromatogram

     2