
Page 42 - LC-SFC_Pharma_Brochure
P. 42
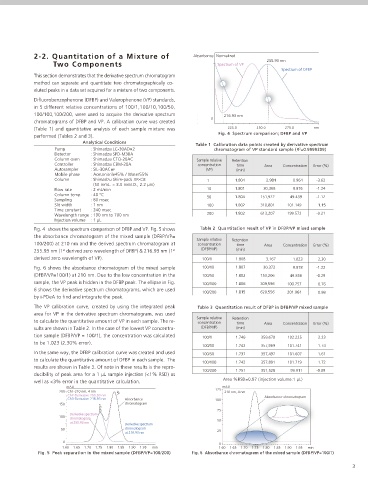
2-2. Quantitation of a Mixture of                    Absorbance  Normalized
                                                                                         255.93 nm
                   Two Components                                        Spectrum of VP
                                                                                              Spectrum of DFBP
            This section demonstrates that the derivative spectrum chromatogram
            method can separate and quantitate two chromatographically co-
            eluted peaks in a data set acquired for a mixture of two components.
            Difluorobenzophenone (DFBP) and Valerophenone (VP) standards,
            in 5 different relative concentrations of 100/1,100/10,100/50,
            100/100,100/200, were used to acquire the derivative spectrum   216.93 nm
                                                                       0
            chromatograms of DFBP and VP. A calibration curve was created
            (Table 1) and quantitative analysis of each sample mixture was   225.0    250.0    275.0     nm
                                                                         Fig. 4  Spectrum comparison; DFBP and VP
            performed (Tables 2 and 3).
                            Analytical Conditions
                                                                  Table 1  Calibration data points created by derivative spectrum
                   Pump        : Shimadzu LC-30AD×2                           chromatogram of VP standard sample (R =0.9999309)
                                                                                                    2
                   Detector    : Shimadzu SPD-M30A
                   Column oven  : Shimadzu CTO-20AC               Sample relative  Retention
                   Controller  : Shimadzu CBM-20A                  concentration  time   Area  Concentration  Error (%)
                   Autosampler  : SIL-30ACMP                         (VP)      (min)
                   Mobile phase  : Acetonitrile45% / Water55%
                   Column      : Shimadzu Shim-pack XR-C8             1        1.804     2,984    0.964   -3.62
                                 (50 mmL. × 3.0 mmI.D., 2.2 µm)
                   Flow rate   : 2 mL/min                             10       1.801    30,368    9.876   -1.24
                   Column temp.  : 40 °C                              50       1.804   151,922   49.439   -1.12
                   Sampling    : 80 msec
                   Slit width  : 1 nm                                 100      1.802   310,801  101.149   1.15
                   Time constant  : 240 msec
                                                                      200      1.802   613,207  199.572   -0.21
                   Wavelength range  : 190 nm to 700 nm
                   Injection volume  : 1 µL
            Fig. 4  shows the spectrum comparison of DFBP and VP. Fig. 5 shows   Table 2  Quantitation result of VP in DFBP/VP mixed sample
            the absorbance chromatogram of the mixed sample (DFBP/VP=
                                                                  Sample relative  Retention
            100/200) at 210 nm and the derived spectrum chromatogram at   concentration  time  Area  Concentration  Error (%)
                      st
                                                          st
            255.93 nm (1  derived zero wavelength of DFBP) & 216.93 nm (1    (DFBP/VP)  (min)
            derived zero wavelength of VP).                         100/1      1.808     3,167    1.023   2.30
            Fig. 6 shows the absorbance chromatogram of the mixed sample   100/10  1.807  30,372  9.878   -1.22
            (DFBP/VP=100/1) at 210 nm. Due to the low concentration in the   100/50  1.802  153,206  49.856  -0.29
            sample, the VP peak is hidden in the DFBP peak. The ellipse in Fig.   100/100  1.806  309,596  100.757  0.76
            6 shows the derivative spectrum chromatograms, which are used
                                                                    100/200    1.815   620,556  201.964   0.98
            by i-PDeA to find and integrate the peak.
            The VP calibration curve, created by using the integrated peak   Table 3  Quantitation result of DFBP in DFBP/VP mixed sample
            area for VP in the derivative spectrum chromatogram, was used
                                                                  Sample relative  Retention
            to calculate the quantitative amount of VP in each sample. The re-  concentration  time  Area  Concentration  Error (%)
            sults are shown in Table 2. In the case of the lowest VP concentra-  (DFBP/VP)  (min)
            tion sample (DFBP/VP = 100/1), the concentration was calculated   100/1  1.746  359,670  102.225  2.23
            to be 1.023 (2.30% error).
                                                                    100/10     1.742   357,969  101.741   1.74
            In the same way, the DFBP calibration curve was created and used   100/50  1.737  357,497  101.607  1.61
            to calculate the quantitative amount of DFBP in each sample.  The
                                                                    100/100    1.742   357,891  101.719   1.72
            results are shown in Table 3. Of note in these results is the repro-
                                                                    100/200    1.751   351,528   99.911   -0.09
            ducibility of peak area for a 1 µL sample injection (<1% RSD) as
                                                                           Area %RSD=0.87 (injection volume:1 µL)
            well as <3% error in the quantitative calculation.
                       mAU                                                 mAU
                     200  Ch1-210 nm, 4 nm  VP                          125  210 nm, 4 nm
                       Ch2-Derivative 255.93 nm                                          Absorbance chromatogram
                       Ch3-Derivative 216.93 nm  Absorbance             100
                     150                  chromatogram
                                   DFBP                                  75
                        Derivative spectrum
                     100
                        chromatogram
                        at 255.93 nm                                     50
                                          Derivative spectrum
                     50                   chromatogram                   25
                                          at 216.93 nm
                      0
                                                                          0
                      1.60  1.65  1.70  1.75  1.80  1.85  1.90  1.95  min  1.60  1.65  1.70  1.75  1.80  1.85  1.90  1.95  min
              Fig. 5  Peak separation in the mixed sample (DFBP/VP=100/200)  Fig. 6  Absorbance chromatogram of the mixed sample (DFBP/VP=100/1)
                                                                                                                      3