
Page 40 - LC-SFC_Pharma_Brochure
P. 40
C190-E166
Fractional Determination of Co-eluted
Technical
Report Compounds Using a New Data Processing
Method for Photodiode Array Detector
Principle and Summary of i-PDeA (Intelligent Peak Deconvolution Analysis)
Toshinobu Yanagisawa 1
Abstract:
The i-PDeA derivative spectrum chromatogram method was developed as a new data processing technique for photodiode array detectors for
HPLC. A derivative spectrum is created by performing differential processing on the UV-Vis absorption spectrum at each measurement time.
Plotting the derivative spectrum values at the specified wavelength against retention time creates a derivative spectrum chromatogram that is
able to separate co-eluted peaks. The high selectivity of the derivative spectrum chromatogram can detect unexpected impurities and quantitate
the target component only, without effects from interfering components that elute simultaneously. This paper formulates the theory of the
derivative spectrum chromatogram method into mathematical expressions and reports details of verification of the basic performance using
standard samples.
Keywords: PDA data processing, peak deconvolution, derivative spectrum chromatogram, Nexera X2, UHPLC
1. Basic Theory of the Derivative
Spectrum Chromatogram Method
Absorbance
1-1. Separation of Two Component S ( λ ) Spectrum of Target
component x
Co-eluted Peaks Spectrum of Target
component y
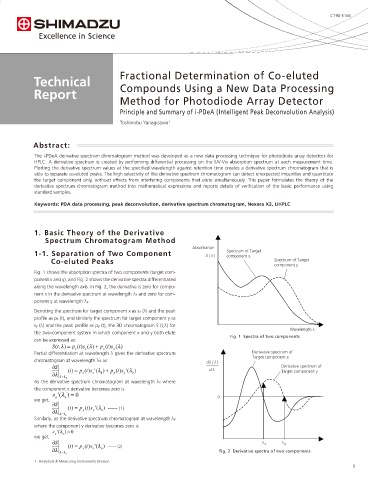
Fig. 1 shows the absorption spectra of two components (target com-
ponent x and y), and Fig. 2 shows the derivative spectra differentiated
along the wavelength axis. In Fig. 2, the derivative is zero for compo-
nent x in the derivative spectrum at wavelength λx and zero for com-
ponent y at wavelength λy.
Denoting the spectrum for target component x as sx (λ) and the peak
profile as px (t), and similarly the spectrum for target component y as
sy (λ) and the peak profile as py (t), the 3D chromatogram S (t,λ) for
Wavelength λ
the two-component system in which component x and y both elute
Fig. 1 Spectra of two components
can be expressed as:
S , (t ) λ = p x t ) ( s x (λ ) + p y t ) ( s y (λ )
Partial differentiation at wavelength λ gives the derivative spectrum Derivative spectrum of
Target component x
chromatogram at wavelength λd as: dS ( λ )
S ∂ ) = ( ' λ ) + ( ' λ d λ Derivative spectrum of
∂ λ λ = d λ (t p x (t )s x d p y (t )s y d ) Target component y
As the derivative spectrum chromatogram at wavelength λx where
the component x derivative becomes zero is
s ( ' λ ) = 0
we get, x x 0
S ∂ ) = ( ' λ
∂ λ λ = x λ (t p y (t )s y x ) ------ (1)
Similarly, as the derivative spectrum chromatogram at wavelength λy
where the component y derivative becomes zero is
s y ( ' λ y ) = 0
we get,
S ∂ ) = ( ' λ λ x λ y
∂ λ λ = y λ (t p x (t )s x y ) ------ (2) Fig. 2 Derivative spectra of two components
1. Analytical & Measuring Instruments Division
1