
Page 39 - LC-SFC_Pharma_Brochure
P. 39
Solution 4: Impurity Detection and Purity Confirmation
Compositional analysis of drugs is an integral part of drug development and production. The purity of the active ingredient
is crucial and varies at different production stages. Other than the active ingredient, impurity analysis is critical to determine
the quality of drugs.
If the chromatographic conditions are not sufficiently optimized, or if the column efficiency is reduced, the impurity peaks
may be buried by the major component, resulting in the misinterpretation and inaccurate quantification of the target
compound.
In addition to the commonly used LC/LCMS, Shimadzu also provides advanced algorithms to fully exploit the performance
of the hardware to help you identify potentially hidden impurities.
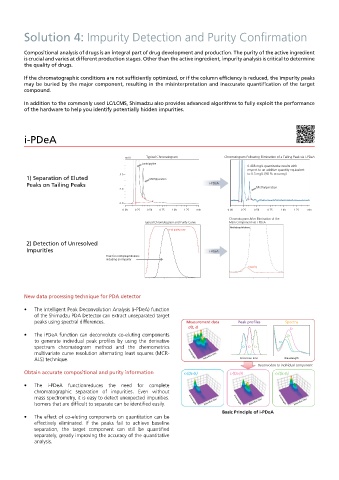
i-PDeA
mAU Typical Chromatogram Chromatogram Following Elimination of a Tailing Peak via i-PDeA
Amitriptyline
0.488 mg/L quantitative results with
respect to an additive quantity equivalent
5.0 to 0.5 mg/L (98 % accuracy)
1) Separation of Eluted Methylparaben
Peaks on Tailing Peaks i -PDeA Methylparaben
2.0
0.0
0.00 0.25 0.50 0.75 1.00 1.25 min 0.00 0.25 0.50 0.75 1.00 1.25 min
Chromatogram After Elimination of the
Typical Chromatogram and Purity Curve Main Component via i-PDeA
Methylnaphthalene
Peak purity curve
2) Detection of Unresolved
Impurities i -PDeA
Peak for methylnaphthalene
including an impurity
Impurity
New data processing technique for PDA detector
• The Intelligent Peak Deconvolution Analysis (i-PDeA) function
of the Shimadzu PDA Detector can extract unseparated target
peaks using spectral differences. Measurement data Spectra
d(t, λ) s2
• The iPDeA function can deconvolute co-eluting components s3
to generate individual peak profiles by using the derivative s1
spectrum chromatogram method and the chemometrics c1 c2 c3
multivariate curve resolution alternating least squares (MCR- Wavelength Retention time
ALS) technique. Retention time Wavelength
Deconvolute to individual component
Obtain accurate compositional and purity information c1(t)s1(λ) c2(t)s2(λ) c3(t)s3(λ)
• The i-PDeA functionreduces the need for complete
chromatographic separation of impurities. Even without
mass spectrometry, it is easy to detect unexpected impurities. Wavelength Wavelength Wavelength
Isomers that are difficult to separate can be identified easily. Retention time Retention time Retention time
Basic Principle of i-PDeA
• The effect of co-eluting components on quantitation can be
effectively eliminated. If the peaks fail to achieve baseline
separation, the target component can still be quantified
separately, greatly improving the accuracy of the quantitative
analysis.