Page 25 - Pharmaceutical Solution for Pharma Analysis
P. 25

LC-15-ADI-036


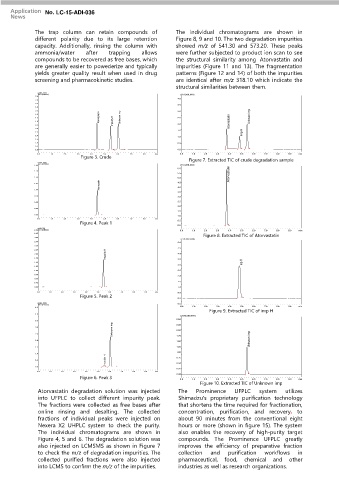
             The trap column can retain compounds of           The individual chromatograms are shown in
             different polarity due to its large retention     Figure 8, 9 and 10. The two degradation impurities
             capacity. Additionally, rinsing the column with   showed m/z of 541.30 and 573.20. These peaks
             ammonia/water     after   trapping    allows      were further subjected to product ion scan to see
             compounds to be recovered as free bases, which    the structural similarity among Atorvastatin and
             are generally easier to powederize and typically  impurities (Figure 11 and 13). The fragmentation
             yields greater quality result when used in drug   patterns (Figure 12 and 14) of both the impurities
             screening and pharmacokinetic studies.            are identical after m/z 318.10 which indicate the
                                                               structural similarities between them.
              mV(x1,000)
               Ch1 (245nm)                                      (x10,000,000)
             7.5
                                                               4.0
             7.0
             6.5
                                                               3.5
             6.0
             5.5                                               3.0
             5.0
             4.5                    Atorvastatin  Unknown imp  2.5                       Unkwon imp
             4.0                         Impurity H                               Atorvastatin
             3.5                                               2.0
             3.0
                                                               1.5
             2.5                                                                      Imp H
             2.0
                                                               1.0
             1.5
             1.0                                               0.5
             0.5
             0.0                                               0.0
              0.0  1.0  2.0  3.0  4.0  5.0  6.0  7.0  8.0  min  0.0  1.0  2.0  3.0  4.0  5.0  6.0  7.0  8.0  9.0  min
                             Figure 3. Crude
                                                                   Figure 7. Extracted TIC of crude degradation sample
              mV(x1,000)
               Ch1 (245nm)
             2.00                                               (x10,000,000)
                                                               6.0
             1.75
                                                               5.5                Atorvastatin
             1.50                                              5.0
                                    Atorvastatin               4.0
             1.25                                              4.5
             1.00
                                                               3.5
             0.75                                              3.0
             0.50                                              2.5
                                                               2.0
             0.25
                                                               1.5
             0.00                                              1.0
              0.0  1.0  2.0  3.0  4.0  5.0  6.0  7.0  8.0  min  0.5
                             Figure 4. Peak 1
                                                               0.0
              mV(x100)
             3.50 Ch1 (245nm)                                   0.0  1.0  2.0  3.0  4.0  5.0  6.0  7.0  8.0  9.0  min
             3.25
                                                                        Figure 8. Extracted TIC of Atorvastatin
             3.00
                                                                (x10,000,000)
             2.75                                              5.0
             2.50
                                                               4.5
             2.25
             2.00                     Impurity H               4.0
             1.75                                              3.5
             1.50                                                                     Imp H
                                                               3.0
             1.25
             1.00                                              2.5
             0.75
                                                               2.0
             0.50
                                                               1.5
             0.25
             0.00                                              1.0
              0.0  1.0  2.0  3.0  4.0  5.0  6.0  7.0  8.0  9.0  min  0.5
                             Figure 5. Peak 2
                                                               0.0
              mV(x1,000)                                       -0.5
               Ch1 (245nm)
             4.5                                                0.0  1.0  2.0  3.0  4.0  5.0  6.0  7.0  8.0  9.0  min
                                                                           Figure 9. Extracted TIC of imp H
             4.0
                                                                (x100,000,000)
                                                               2.50
             3.5
                                         Unknown imp           2.00
             3.0                                               2.25
             2.5                                               1.75
             2.0                                               1.50                      Unkwon imp
             1.5                                               1.25
                                                               1.00
             1.0
             0.5                      Impurity H               0.75
                                                               0.50
             0.0
                                                               0.25
              0.0  1.0  2.0  3.0  4.0  5.0  6.0  7.0  8.0  9.0  min
                                                               0.00
                             Figure 6. Peak 3                   0.0  1.0  2.0  3.0  4.0  5.0  6.0  7.0  8.0  9.0  min
                                                                       Figure 10. Extracted TIC of Unknown imp
              Atorvastatin degradation solution was injected    The   Prominence   UFPLC    system   utilizes
              into UFPLC to collect different impurity peak.    Shimadzu's proprietary purification technology
              The fractions were collected as free bases after  that shortens the time required for fractionation,
              online rinsing and desalting. The collected       concentration, purification, and recovery, to
              fractions of individual peaks were injected on    about 90 minutes from the conventional eight
              Nexera X2 UHPLC system to check the purity.       hours or more (shown in figure 15). The system
              The individual chromatograms are shown in         also enables the recovery of high-purity target
              Figure 4, 5 and 6. The degradation solution was   compounds. The Prominence UFPLC greatly
              also injected on LCMSMS as shown in Figure 7      improves the efficiency of preparative fraction
              to check the m/z of degradation impurities. The   collection  and  purification  workflows  in
              collected purified fractions were also injected   pharmaceutical,  food,  chemical  and  other
              into LCMS to confirm the m/z of the impurities.   industries as well as research organizations.
   20   21   22   23   24   25   26   27   28   29   30