
Page 25 - Shimadzu-MassSpectrometerCatalog
P. 25
GCMS
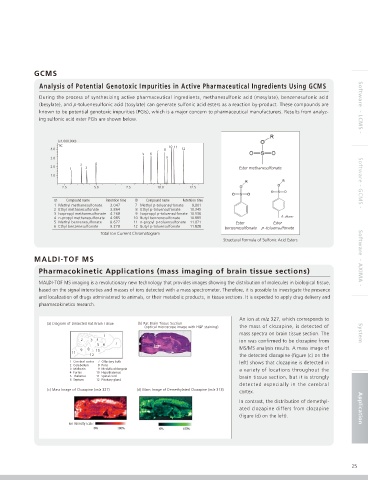
Analysis of Potential Genotoxic Impurities in Active Pharmaceutical Ingredients Using GCMS
During the process of synthesizing active pharmaceutical ingredients, methanesulfonic acid (mesylate), benzenesufonic acid
(besylate), and p-toluenesulfonic acid (tosylate) can generate sulfonic acid esters as a reaction by-product. These compounds are Software - LCMS -
known to be potential genotoxic impurities (PGIs), which is a major concern to pharmaceutical manufacturers. Results from analyz-
ing sulfonic acid ester PGIs are shown below.
(x1,000,000)
TIC 10 11
4.0 8 12
7
5 6
3.0 9
4
2.0 2 3 Ester methanesulfonate
1
1.0
2.5 5.0 7.5 10.0 12.5 Software - GCMS -
ID Compound name Retention time ID Compound name Retention time
1 Methyl methanesulfonate 3.047 7 Methyl p-toluensulfonate 9.801
2 Ethyl methanesulfonate 3.864 8 Ethyl p-toluensulfonate 10.345
3 Isopropyl methanesulfonate 4.268 9 Isopropyl p-toluensulfonate 10.536
4 n-propyl methanesulfonate 4.985 10 Butyl benzenesulfonate 10.885 R: alkane
5 Methyl benzenesulfonate 8.677 11 n-propyl p-toluensulfonate 11.071 Ester Ester
6 Ethyl benzenesulfonate 9.278 12 Butyl p-toluensulfonate 11.828
benzenesulfonate p -toluensulfonate
Total Ion Current Chromatogram
Structural Formula of Sulfonic Acid Esters
MALDI-TOF MS Software - AXIMA -
Pharmacokinetic Applications (mass imaging of brain tissue sections)
MALDI-TOF MS imaging is a revolutionary new technology that provides images showing the distribution of molecules in biological tissue,
based on the signal intensities and masses of ions detected with a mass spectrometer. Therefore, it is possible to investigate the presence
and localization of drugs administered to animals, or their metabolic products, in tissue sections. It is expected to apply drug delivery and
pharmacokinetics research.
An ion at m/z 327, which corresponds to
(a) Diagram of Dissected Rat Brain Tissue (b) Rat Brain Tissue Section
(optical microscope image with H&E staining) the mass of clozapine, is detected of
Impurity 2
Impurity 2 1 mass spectra on brain tissue section. The System
2 3 4 ion was confirmed to be clozapine from
5 6 7
9 8 10 MS/MS analysis results. A mass image of
11
12 the detected clozapine (figure (c) on the
1 Cerebral cortex 7 Olfactory bulb left) shows that clozapine is detected in
2 Cerebellum 8 Pons
3 Midbrain 9 Medulla oblongata a variety of locations throughout the
4 Fornix 10 Hypothalamus
5 Thalamus 11 Spinal cord brain tissue section, but it is strongly
6 Septum 12 Pituitary gland
detected especially in the cerebral
(c) Mass Image of Clozapine (m/z 327) (d) Mass Image of Demethylated Clozapine (m/z 313)
cortex.
In contrast, the distribution of demethyl-
ated clozapine differs from clozapine Application
(figure (d) on the left).
Ion intensity scale:
25