Page 30 - Shimadzu-MassSpectrometerCatalog
P. 30

Chemical


            LCMS-8030
              Mass Chromatogram of Plastic Plate Extract by Synchronized Survey Scan

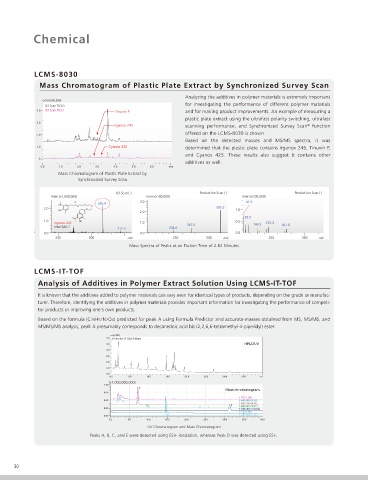
                                                              Analyzing the additives in polymer materials is extremely important
               (×100,000,000)
                                                              for investigating the performance of different polymer materials
                Q3 Scan TIC(+)
             4.0  Q3 Scan TIC(-)
                                       Tinuvin P              and for making product improvements. An example of measuring a
                                                              plastic plate extract using the ultrafast polarity switching, ultrafast
             3.0
                                       Irganox 245            scanning performance, and Synchronized Survey Scan  function
                                                                                                       ®
                                                              offered on the LCMS-8030 is shown.
             2.0
                                                              Based on the detected masses and MS/MS spectra, it was
             1.0                     Cyanox 425               determined that the plastic plate contains Irganox 245, Tinuvin P,
                                                              and Cyanox 425. These results also suggest it contains other
              0
                                                              additives as well.
               0.0  1.0    2.0   3.0   4.0   5.0   6.0   min
                    Mass Chromatogram of Plastic Plate Extract by
                           Synchronized Survey Scan
                                       Q3 Scan (-)                 Product Ion Scan (-)            Product Ion Scan (-)
                  Inten.(x1,000,000)              Inten.(x100,000)               Inten.(x100,000)
                          O      585.4         3.0                                41.5
                             O
                          O    O
                2.0           O                                          585.3  1.0
                    HO                         2.0
                             O
                                                                                  82.9
                1.0        OH                                                  0.5
                   Irganox 245                 1.0             367.0                 149.3  233.3
                   MW 586.7                              234.6                                367.0
                                        717.3
                0.0                            0.0                             0.0
                   250        500          m/z            250        500   m/z            250        500   m/z
                                            Mass Spectra of Peaks at an Elution Time of 2.82 Minutes
            LCMS-IT-TOF
              Analysis of Additives in Polymer Extract Solution Using LCMS-IT-TOF

              It is known that the additives added to polymer materials can vary even for identical types of products, depending on the grade or manufac-
              turer. Therefore, identifying the additives in polymer materials provides important information for investigating the performance of competi-
              tor products or improving one's own products.
              Based on the formula (C28H52N2O4) predicted for peak A using Formula Predictor and accurate masses obtained from MS, MS/MS, and
              MS/MS/MS analysis, peak A presumably corresponds to decanedoic acid bis (2,2,6,6-tetramethyl-4-piperidyl) ester.

                                      Detector A
                                                                                  HPLC/UV


                                     (x1,000,000,000)
                                               B
                                                                            Mass chromatogram
                                        A
                                                  C                          E
                                                        D

                                                  UV Chromatogram and Mass Chromatogram
                               Peaks A, B, C, and E were detected using ESI+ ionization, whereas Peak D was detected using ESI-.


      30
   25   26   27   28   29   30   31   32   33   34