
Page 33 - Shimadzu-MassSpectrometerCatalog
P. 33
GCMS-TQ8030
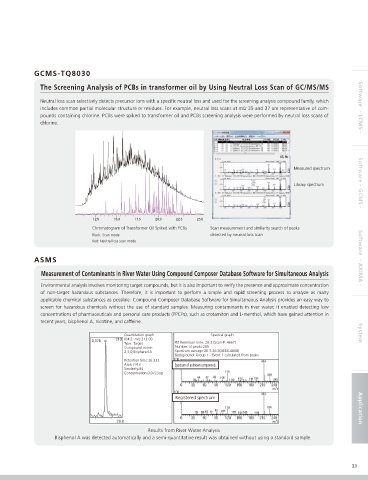
The Screening Analysis of PCBs in transformer oil by Using Neutral Loss Scan of GC/MS/MS
Neutral loss scan selectively detects precursor ions with a specific neutral loss and used for the screening analysis compound family, which
includes common partial molecular structure or residues. For example, neutral loss scans at m/z 35 and 37 are representative of com- Software - LCMS -
pounds containing chlorine. PCBs were spiked to transformer oil and PCBs screening analysis were performed by neutral loss scans of
chlorine.
Measured spectrum
Library spectrum Software - GCMS -
Chromatogram of Transformer Oil Spiked with PCBs Scan measurement and similarity search of peaks
Black: Scan mode detected by neutral loss scan
Red: Neutral loss scan mode
ASMS Software - AXIMA -
Measurement of Contaminants in River Water Using Compound Composer Database Software for Simultaneous Analysis
Environmental analysis involves monitoring target compounds, but it is also important to verify the presence and approximate concentration
of non-target hazardous substances. Therefore, it is important to perform a simple and rapid screening process to analyze as many
applicable chemical substances as possible. Compound Composer Database Software for Simultaneous Analysis provides an easy way to
screen for hazardous chemicals without the use of standard samples. Measuring contaminants in river water, it enabled detecting low
concentrations of pharmaceuticals and personal care products (PPCPs), such as crotamiton and L-menthol, which have gained attention in
recent years, bisphenol A, nicotine, and caffeine.
Quantitation graph Spectral graph System
ID#:2 m/z:213.00
Type: Target #2 Retention time: 26.3 (Scan #: 4667)
Compound name: Number of peaks:265
2;3;0;Bisphenol A Spectrum average:26.3-26.3(4666-4668)
Background: Group 1 - Event 1 calculated from peaks
Retention time:26.332
Area:7943 Spectrum of unknown components
Similarity:84
Concentration:0.0723ug
Registered spectrum Application
Results from River Water Analysis
Bisphenol A was detected automatically and a semi-quantitative result was obtained without using a standard sample.
33