Page 29 - Shimadzu-MassSpectrometerCatalog
P. 29

LCMS-2020

              Componential Analysis Using DART-MS of Ultra-Fast Polarity Switching

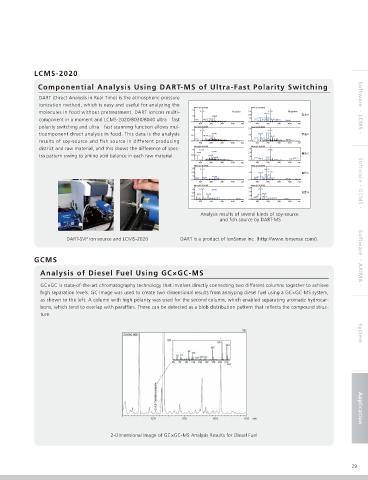
              DART (Direct Analysis in Real Time) is the atmospheric pressure
              ionization method, which is easy and useful for analyzing the
                                                                 Inten.(x100,000)   Inten.(x100,000)                    Software  - LCMS -
              molecules in food without pretreatment. DART ionizes multi-  2.0  115.75  Positive    3.0  187.10 217.10  Negative
                                                                1.0    230.80      2.0               ে༉ "
                                                                                      128.15
              component in a moment and LCMS-2020/8030/8040 ultraɹfast   69.85  146.75  198.75  1.0  51.25 117.15  164.05 189.10  238.10 289.10  384.20
                                                                0.0                0.0
                                                                   100  200  300  400  m/z  100  200  300  400  m/z
              polarity switching and ultraɹfast scanning function allows mul-  Inten.(x100,000)  Inten.(x100,000)
                                                                1.0  115.75        2.0    217.15
              ticomponent direct analysis in food. This data is the analysis   0.5  146.80 196.80 226.80  1.0  128.15  202.15  ে༉ #
                                                                                     51.55  146.15  236.10
                                                                  69.75
              results of soy-source and fish source in different producing   0.0  100  200  300  400  m/z  0.0  100 117.10  200  300  384.20 400  m/z
              district and raw material, and this shows the difference of spec-  1.0 Inten.(x100,000)  3.0 Inten.(x100,000)  217.10
                                                                   111.75
                                                                  88.80  226.80    2.0               ে༉ $
              tra pattern owing to amino acid balance in each raw material.  0.5 71.85  196.85 240.85  1.0  51.95  202.20
                                                                0.0                0.0  128.15   418.10 480.15
                                                                   100  200  300  400  m/z  100  200  300  400  m/z
                                                                 Inten.(x100,000)   Inten.(x100,000)
 A  B                                                           3.0  115.75        2.5  128.10  187.10 217.10  ڕে ,
                                                                2.0
                                                                1.0    228.80         117.10 164.10 189.10
                                                                  69.80  137.80  252.80  51.30  238.15
                                                                0.0                0.0  89.15   384.10  475.10
                                                                   100  200  300  400  m/z  100  200  300  400  m/z     Software - GCMS -
                                                                 Inten.(x100,000)   Inten.(x100,000)
                                                                                   3.0
                                                                1.5  113.75  226.80   128.15
                                                                1.0                2.0  164.10       ڕে /
                                                                  59.85  172.80       117.15
                                                                0.5     259.75     1.0  51.40  166.10
                                                                                     89.15
                                                                0.0  83.80  199.80  449.95  0.0  209.10 257.15  369.95
                                                                   100  200  300  400  m/z  100  200  300  400  m/z
                                                                   Analysis results of several kinds of soy-source
                                                                          and fish source by DART-MS
                       DART-SVP ion source and LCMS-2020     DART is a product of IonSense Inc. (http://www.ionsense.com/).
            GCMS                                                                                                        Software  - AXIMA -
              Analysis of Diesel Fuel Using GC×GC-MS
              GC×GC is state-of-the-art chromatography technology that involves directly connecting two different columns together to achieve
              high separation levels. GC Image was used to create two-dimensional results from analyzing diesel fuel using a GC×GC-MS system,
              as shown to the left. A column with high polarity was used for the second column, which enabled separating aromatic hydrocar-
              bons, which tend to overlap with paraffins. These can be detected as a blob distribution pattern that reflects the compound struc-
              ture.                                                                                                     System


                                      2-Dimensional Image of GC×GC-MS Analysis Results for Diesel Fuel                  Application


                                                                                                                      29
   24   25   26   27   28   29   30   31   32   33   34