
Page 24 - Shimadzu-MassSpectrometerCatalog
P. 24
Application
LCMS-8080
LCMS-8080 CYP cocktail assay: Reagents
This assay is standard method for checking toxicity and safety of drug candidates. P450 enzymes metabolizes toxin. The inhibition of drug
candidates is investigated by mixing substrates, P450 and drug and react enzyme.
The mixture of 5 substrates were metabolized in human liver microsome (=P450 enzyme) and then metabolites were quantified by LCMS-8080.
All five metabolites were successfully quantified even though their actual concentration ranging from 0.9 to 900nM.
• The results with polarity switching experiment did not pale against the results with dedicated polarity.
• The 20 msec polarity switching capability helps researchers need to grab the ultra high sensitivity and data quality.
Substrates Metabolites/Products P450 Enzyme LOD / nM LOQ / nM
Resorufin ethyl ether Resorufin CYP 1A2 0.01 0.6
Bufuralol hydrochloride 1`-Hydroxy bufuralol CYP 2D6 0.21 0.6
(S)-Mephenytoin (+/-)-4`-Hydroxy mephenytoin CYP 2C19 0.37 0.6
Nifedipine Oxidized nifedipine CYP 3A4 0.002 0.6
Tolbutamide Hydroxy tolbutamide CYP 2C9 0.003 0.6
Resorufin (+) 1’-Hydroxy bufuralol (+) (+/-)-4’-Hydorxy mephenytoin (+) Oxidized nifedipine (+) Hydroxy tolbutamide (-)
214.0>186.0 278.2>186.0 235.0>150.2 345.0>284.0 285.0>186.0
LCMS-IT-TOF
2-Dimensional LC/LCMS-IT-TOF System Capable of Using Mobile Phase Conditions Not Suited to MS analysis
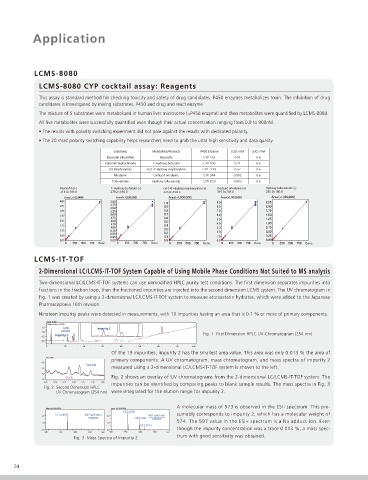
Two-dimensional LC/LCMS-IT-TOF systems can use unmodified HPLC purity test conditions. The first dimension separates impurities into
fractions in the fraction loop, then the fractioned impurities are injected into the second dimension LCMS system. The UV chromatogram in
Fig. 1 was created by using a 2-dimensional LC/LCMS-IT-TOF system to measure atorvastatin hydrates, which were added to the Japanese
Pharmacopoeia 16th revision.
Nineteen impurity peaks were detected in measurements, with 10 impurities having an area that is 0.1 % or more of primary components.
mAU (x10)
254nm,4nm (1.00)
1.5 Conc. Impurity 2 2
I
m
p
t
y
i
u
r
0.013%
1.0 Fig. 1 First Dimension HPLC UV Chromatogram (254 nm)
i
y
t
r
m
I Impurity 2 2
u
p
0.5
0.0
0 10 20 30 40 50 60 70 min
Of the 19 impurities, impurity 2 has the smallest area value. This area was only 0.013 % the area of
uV (x100)
primary components. A UV chromatogram, mass chromatogram, and mass spectra of impurity 2
6.0
Sample
5.0 measured using a 2-dimensional LC/LCMS-IT-TOF system is shown to the left.
4.0
Blank Fig. 2 shows an overlay of UV chromatograms from the 2-dimensional LC/LCMS-IT-TOF system. The
3.0
4.25 4.50 4.75 5.00 5.25 5.50 min impurities can be identified by comparing peaks to blank sample results. The mass spectra in Fig. 3
Fig. 2 Second Dimension HPLC
UV Chromatogram (254 nm) were integrated for the elution range for impurity 2.
A molecular mass of 573 is observed in the ESI- spectrum. This pre-
Inten. (x1,000,000) Inten. (x1,000,000)
557.2470
573.2400 MS 1 spectrum sumably corresponds to impurity 2, which has a molecular weight of
2.0 2.0 MS 1 spectrum
negative 597.2381 positive
1.0 1.0 574. The 597 value in the ESI+ spectrum is a Na adduct ion. Even
613.2161
though the impurity concentration was a trace 0.013 %, a mass spec-
0.0 0.0
500 550 600 650 m/z 500 550 600 650 m/z
trum with good sensitivity was obtained.
Fig. 3 Mass Spectra of Impurity 2
24