Page 23 - Shimadzu-MassSpectrometerCatalog
P. 23

GCMS

             Analysis of Amino, Organic, and Fatty Acids Using GC/MS Metabolite Component Database
             GC-MS systems are often used in metabolomic and biochemical diagnostic research fields to measure amino acids, organic acids, or
             fatty acids in urine or blood. Shimadzu worked jointly with the Shimane University Faculty of Medicine to develop a GC/MS Metabolite
             Component Database, containing information on over 300 types of metabolites and other substances (amino acids, organic acids, and   Software  - LCMS -
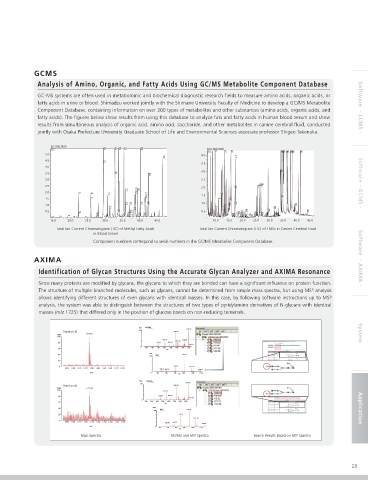
             fatty acids). The figures below show results from using this database to analyze fats and fatty acids in human blood serum and show
             results from simultaneous analysis of organic acid, amino acid, saccharide, and other metabolites in canine cerebral fluid, conducted
             jointly with Osaka Prefecture University Graduate School of Life and Environmental Sciences associate professor Shigeo Takenaka.

                  (x1,000,000)
                  TIC               13    17    19    21    34        (x10,000,000)   21     31
                                                                         TIC  4                14 3      18 4  18 5    18 6      18 7  18 8
                5.0                                                 4.0
                                                        40                      47
                4.5
                                    12                              3.5
                4.0
                                                                    3.0                        18 3
                3.5                     16         39
                3.0                                                 2.5                                                 Software - GCMS -
                2.5                                                 2.0        45      94 0 1    18   18
                                           22    31
                2.0         5   8    14       29  30                   1   12
                                9                 36  37            1.5                        14 7
                1.5                                                       8   29
                                           23    26    33    38     1.0      26     44
                1.0                                                         20                     16 4
                                      15      28                         7                  18 2
                0.5         6     10   11    18    24      25  27    32    35    0.5  17 9       50       56      68 60 63      86     87     10 9    11 4     8 12 2   11   13 5      17 5
                                                                                 58 59
                   1   2   3   4   7      20                               15     38  40        70     76       80  11 6  13 8
                  15.0  20.0  25.0  30.0  35.0  40.0  45.0             10.0   15.0   20.0   25.0   30.0   35.0   40.0   45.0
                    Total Ion Current Chromatogram (TIC) of Methyl Fatty Acids   Total Ion Current Chromatogram (TIC) of TMSs in Canine Cerebral Fluid
                                in Blood Serum
                                Component numbers correspond to serial numbers in the GC/MS Metabolite Component Database.
            AXIMA                                                                                                       Software  - AXIMA -
              Identification of Glycan Structures Using the Accurate Glycan Analyzer and AXIMA Resonance
              Since many proteins are modified by glycans, the glycans to which they are bonded can have a significant influence on protein function.
                                                                                                        n
              The structure of multiple branched molecules, such as glycans, cannot be determined from simple mass spectra, but using MS  analysis
              allows identifying different structures of even glycans with identical masses. In this case, by following software instructions up to MS 3
              analysis, the system was able to distinguish between the structures of two types of pyridylamino derivatives of N-glycans with identical
              masses (m/z 1725) that differed only in the position of glucose bonds on non-reducing terminals.


                                               %Int.  MS/MS    1707.62
                      Fraction 2)              100        1280.45
                    %Int.    1725.63                                                                                    System
                    100
                                                       915.30  1570.91
                                                           1342.49
                    80                               712.22  1077.32
                                                                1725.71
                                                0
                    60                           300  500  700  900  m/z  1100  1300  1500  1700
                    40                            %Int.  MS 3  915.31
                                                  100
                    20
                     0                                     712.19  1077.36
                      1690  1700  1710  1720  1730  1740  1750  1760  1770  1780
                                                      388.10 509.12  1280.45
                               m/z                 0  300  500  700  m/z  900  1100  1300
                                               %Int.  MS/MS
                                                              1707.62
                                               100
                      Fraction 4)                         1280.42
                    %Int.     1725.63
                    100
                                                       915.29
                    80                               712.20  1077.33
                                                               1725.64
                                                0
                                                 200  400  600  800  1000  1200  1400  1600
                    60
                                                        m/z
                    40                              %Int.                                                               Application
                                                    100  MS 3  915.30
                    20                                      712.21
                                                                 1077.34
                     0
                      1690  1700  1710  1720  1730  1740  1750  1760  1770  1780  388.08  550.14  128042
                               m/z                  0
                                                      200  400  600  800  1000  1200
                                                            m/z
                                                                                                   3
                                                                  3
                            Mass Spectra                  MS/MS and MS  Spectra      Search Results Based on MS  Spectra
                                                                                                                      23
   18   19   20   21   22   23   24   25   26   27   28