
Page 22 - Shimadzu-MassSpectrometerCatalog
P. 22
Applications
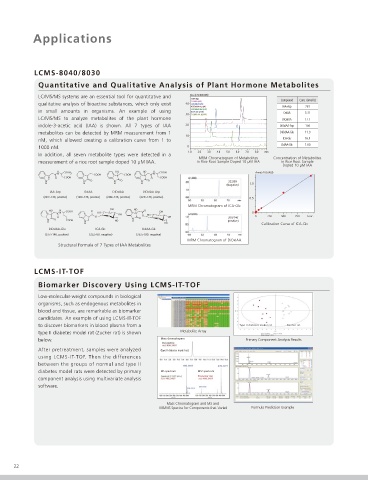
LCMS-8040/8030
Quantitative and Qualitative Analysis of Plant Hormone Metabolites
LC/MS/MS systems are an essential tool for quantitative and Area (×10,000,000)
1:IAA-Asp Compound Conc. (nmol/L)
2:OxlAA (x60)
qualitative analysis of bioactive substances, which only exist 4.0 3:DiOxlAA (x35)
4:DiOxIAA-Asp (x4) IAA-Asp 781
in small amounts in organisms. An example of using 5:DiOxIAA-Glu (x30) OxIAA 5.31
6:ICA-Glc (x130)
3.0 7:OxlAA-Glc (x3600)
LC/MS/MS to analyze metabolites of the plant hormone DiOxIAA 17.1
indole-3-acetic acid (IAA) is shown. All 7 types of IAA 2.0 DiOxIAA-Asp 156
metabolites can be detected by MRM measurement from 1 DiOxIAA-Glu 11.9
1.0
nM, which allowed creating a calibration curve from 1 to ICA-Glc 16.4
OxIAA-Glc 1.60
1000 nM. 0
1.0 2.0 3.0 4.0 5.0 6.0 7.0 8.0 min
In addition, all seven metabolite types were detected in a
MRM Chromatogram of Metabolites Concentration of Metabolites
measurement of a rice root sample doped 10 µM IAA. in Rice Root Sample Doped 10 µM IAA in Rice Root Sample
Doped 10 µM IAA
H COOH HO HO H COOH Area(×100,000)
N COOH COOH N
O COOH O COOH
N N O N O N O 322/89
H H H H 1.0
(Negative)
IAA-Asp OxIAA DiOxIAA DiOxIAA-Asp
(291>130, positive) (192>146, positive) (208>146, positive) (323>146, positive)
0.5
MRM Chromatogram of ICA-Glc
OH HO
HO H COOH O O OH
N HO 0
O OH O HO
O O O O OH 208/146 0 250 500 750 Conc.
N O COOH HO N H (povitive)
H N H HO Calibration Curve of ICA-Glc
DiOxIAA-Glu ICA-Glc OxIAA-Glc
(337>146, positive) (322>89, negative) (352>190, negative)
MRM Chromatogram of DiOxIAA
Structural Formula of 7 Types of IAA Metabolites
LCMS-IT-TOF
Biomarker Discovery Using LCMS-IT-TOF
Low-molecular-weight compounds in biological
organisms, such as endogenous metabolites in
blood and tissue, are remarkable as biomarker
candidates. An example of using LCMS-IT-TOF
to discover biomarkers in blood plasma from a Type II diabetes model rat Normal rat
type II diabetes model rat (Zucker rat) is shown Metabolite Array
below. Mass chromatogram Primary Component Analysis Results
After pretreatment, samples were analyzed (Type II diabetes model rat)
using LCMS-IT-TOF. Then the differences
between the groups of normal and type II
diabetes model rats were detected by primary MS spectrum MS 2 spectrum
Precursor ion
component analysis using multivariate analysis
software.
Mass Chromatogram and MS and
MS/MS Spectra for Components that Varied Formula Prediction Example
22