
Page 7 - LifeScience Solutions for Stem Cell Analysis
P. 7
Comparative Metabolomics
of Human ES Cells
GC-MS
Data
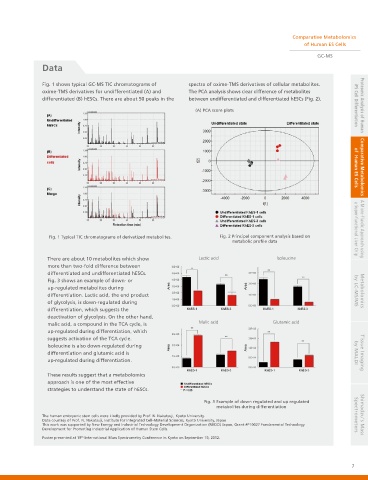
Fig. 1 shows typical GC-MS TIC chromatograms of spectra of oxime-TMS derivatives of cellular metabolites.
oxime-TMS derivatives for undifferentiated (A) and The PCA analysis shows clear difference of metabolites
differentiated (B) hESCs. There are about 50 peaks in the between undifferentiated and differentiated hESCs (Fig. 2).
(A) PCA score plots iPS Cell Differentiation Proteomic Analysis of Human
of Human ES Cells
Comparative Metabolomics
Fig. 1 Typical TIC chromatograms of derivatized metabolites. Fig. 2 Principal component analysis based on a Super-functional Liver Chip A Micro-fluidic Approach using
metabolic profile data
There are about 10 metabolites which show Lactic acid lsoleucine
more than two-fold difference between
differentiated and undifferentiated hESCs.
Fig. 3 shows an example of down- or
up-regulated metabolites during by LC-MS/MS Metabolomics
differentiation. Lactic acid, the end product
of glycolysis, is down-regulated during
differentiation, which suggests the
deactivation of glycolysis. On the other hand,
Malic acid Glutamic acid
malic acid, a compound in the TCA cycle, is
up-regulated during differentiation, which
suggests activation of the TCA cycle.
Isoleucine is also down-regulated during
differentiation and glutamic acid is by MALDI Tissue Imaging
up-regulated during differentiation.
These results suggest that a metabolomics
approach is one of the most effective
strategies to understand the state of hESCs.
Fig. 3 Example of down regulated and up regulated
metabolites during differentiation
The human embryonic stem cells were kindly provided by Prof. N. Nakatsuji, Kyoto University. Spectrometers Shimadzu’s Mass
Data courtesy of Prof. N. Nakatsuji, Institute for Integrated Cell-Material Sciences, Kyoto University, Japan
This work was supported by New Energy and Industrial Technology Development Organization (NEDO) Japan, Grant #P10027 Fundamental Technology
Development for Promoting Industrial Application of Human Stem Cells.
Poster presented at 19 International Mass Spectrometry Conference in Kyoto on September 19, 2012.
th
7