
Page 5 - LifeScience Solutions for Stem Cell Analysis
P. 5
Proteomic Analysis of Human
iPS Cell Differentiation
MALDI-TOF MS
Data
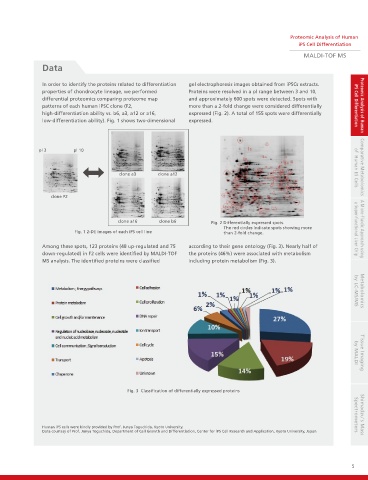
In order to identify the proteins related to differentiation gel electrophoresis images obtained from iPSCs extracts.
properties of chondrocyte lineage, we performed Proteins were resolved in a pl range between 3 and 10,
differential proteomics comparing proteome map and approximately 600 spots were detected. Spots with
patterns of each human iPSC clone (F2, more than a 2-fold change were considered differentially iPS Cell Differentiation Proteomic Analysis of Human
high-differentiation ability vs. b6, a3, a12 or a16, expressed (Fig. 2). A total of 155 spots were differentially
low-differentiation ability). Fig. 1 shows two-dimensional expressed.
pl 3 pl 10
clone a3 clone a12 of Human ES Cells Comparative Metabolomics
clone F2
clone a16 clone b6 Fig. 2 Differentially expressed spots.
The red circles indicate spots showing more A Micro-fluidic Approach using
Fig. 1 2-DE images of each iPS cell line than 2-fold change. a Super-functional Liver Chip
Among these spots, 123 proteins (48 up-regulated and 75 according to their gene ontology (Fig. 3). Nearly half of
down-regulated) in F2 cells were identified by MALDI-TOF the proteins (46%) were associated with metabolism
MS analysis. The identified proteins were classified including protein metabolism (Fig. 3). by LC-MS/MS Metabolomics
Fig. 3 Classification of differentially expressed proteins by MALDI Tissue Imaging
Human iPS cells were kindly provided by Prof. Junya Toguchida, Kyoto University. Spectrometers Shimadzu’s Mass
Data courtesy of Prof. Junya Toguchida, Department of Cell Growth and Differentiation, Center for iPS Cell Research and Application, Kyoto University, Japan
5