Page 11 - LifeScience Solutions for Stem Cell Analysis
P. 11

Metabolomics by LC-MS/MS
                                                                                                         LC-MS/MS
               Data


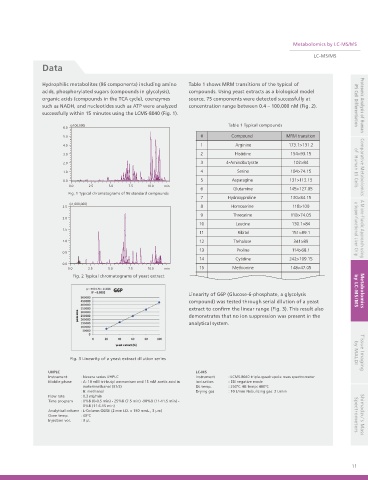
               Hydrophilic metabolites (96 components) including amino   Table 1 shows MRM transitions of the typical of
               acids, phosphorylated sugars (compounds in glycolysis),   compounds. Using yeast extracts as a biological model
               organic acids (compounds in the TCA cycle), coenzymes   source, 75 components were detected successfully at
               such as NADH, and nucleotides such as ATP were analyzed   concentration range between 0.4 – 100,000 nM (Fig. 2).  iPS Cell Differentiation  Proteomic Analysis of Human
               successfully within 15 minutes using the LCMS-8040 (Fig. 1).

                        (x100,000)                                           Table 1 Typical compounds
                      6.0
                      5.0                                          #          Compound          MRM transition
                      4.0                                          1           Arginine          173.1>131.2
                      3.0                                          2           Histidine         154>93.15
                      2.0                                          3        4-Aminobutyrate       102>84                of  Human ES Cells  Comparative Metabolomics
                      1.0                                          4            Serine           104>74.15
                      0.0                                          5          Asparagine         131>113.15
                        0.0    2.5    5.0    7.5    10.0  min
                                                                   6          Glutamine          145>127.05
                        Fig. 1 Typical chromatograms of 96 standard compounds
                                                                   7         Hydroxyproline      130>84.15
                        (x1,000,000)
                      2.5                                          8          Homoserine          118>100
                                                                   9          Threonine          118>74.05
                      2.0
                                                                   10          Leucine            130.1>84
                      1.5                                                                                              a Super-functional Liver Chip  A Micro-fluidic Approach using
                                                                   11           Ribitol           151>89.1
                      1.0                                          12         Trehalose           341>89
                                                                   13          Proline            114>68.1
                      0.5
                                                                   14          Cytidine          242>109.15
                      0.0
                        0.0    2.5    5.0    7.5    10.0  min      15         Methionine         148>47.05
                          Fig. 2 Typical chromatograms of yeast extract

                                                                Linearity of G6P (Glucose-6-phosphate, a glycolysis    by LC-MS/MS  Metabolomics
                                                                compound) was tested through serial dilution of a yeast
                                                                extract to confirm the linear range (Fig. 3). This result also
                                                                demonstrates that no ion suppression was present in the
                                                                analytical system.


                        Fig. 3 Linearity of a yeast extract dilution series                                            by MALDI  Tissue Imaging

                 UHPLC                                            LC-MS
                 Instrument  : Nexera series UHPLC                Instrument  : LCMS-8040 triple-quadrupole mass spectrometer
                 Mobile phase   : A: 10 mM tri-butyl ammonium and 15 mM acetic acid in   Ionization  : ESI negative mode
                              water/methanol (97/3)               DL temp.   : 250°C HB temp: 400°C
                            : B: methanol                         Drying gas  : 10 L/min Nebulizing gas: 2 L/min
                 Flow rate  : 0.3 mL/min
                 Time program  : 0%B (0-0.5 min) - 25%B (7.5 min) -90%B (11-11.5 min) -
                              0%B (11.6-15 min)
                 Analytical column : L-Column ODSII (2 mm I.D. × 150 mmL., 3 µm)
                 Oven temp.  : 40°C                                                                                    Spectrometers  Shimadzu’s Mass
                 Injection vol.  : 3 µL


                                                                                                                      11
   6   7   8   9   10   11   12   13   14   15   16