Page 13 - LifeScience Solutions for Stem Cell Analysis
P. 13

Tissue Imaging by MALDI
                                                                                                       MALDI-TOF MS
               Data


                                                   m/z 426
                                                   [ADP-H]  -


                                                         m/z 506                                                       iPS Cell Differentiation  Proteomic Analysis of Human
                                                         [ATP-H]  -


                                       m/z 346
                                       [AMP-H ] -                 m/z 664                m/z 904
                                                                 [NADH-H]  -           [Sul fatide-H] -


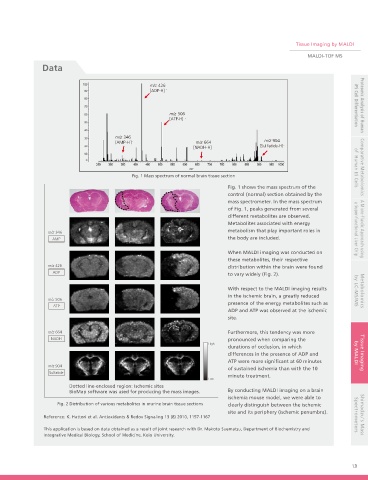
                                             Fig. 1 Mass spectrum of normal brain tissue section                        of  Human ES Cells  Comparative Metabolomics
                                                                             Fig. 1 shows the mass spectrum of the
                                                                             control (normal) section obtained by the
                                                                             mass spectrometer. In the mass spectrum
                                                                             of Fig. 1, peaks generated from several
                                                                             different metabolites are observed.
                                                                             Metabolites associated with energy
                 m/z 346                                                     metabolism that play important roles in   a Super-functional Liver Chip  A Micro-fluidic Approach using
                  AMP                                                        the body are included.

                                                                             When MALDI imaging was conducted on
                                                                             these metabolites, their respective
                 m/z 426                                                     distribution within the brain were found
                   ADP                                                       to vary widely (Fig. 2).

                                                                             With respect to the MALDI imaging results   by LC-MS/MS  Metabolomics
                                                                             in the ischemic brain, a greatly reduced
                 m/z 506
                                                                             presence of the energy metabolites such as
                   ATP
                                                                             ADP and ATP was observed at the ischemic
                                                                             site.
                 m/z 664                                                     Furthermore, this tendency was more
                  NADH                                                       pronounced when comparing the
                                                                      High
                                                                             durations of occlusion, in which
                                                                             differences in the presence of ADP and    by MALDI  Tissue Imaging
                                                                             ATP were more significant at 60 minutes
                 m/z 904
                                                                             of sustained ischemia than with the 10
                 Sulfatide
                                                                             minute treatment.
                                                                      Low
                        Dotted line-enclosed region: Ischemic sites
                        BioMap software was used for producing the mass images.  By conducting MALDI imaging on a brain
                                                                             ischemia mouse model, we were able to
                    Fig. 2 Distribution of various metabolites in murine brain tissue sections  clearly distinguish between the ischemic
                                                                             site and its periphery (ischemic penumbra).
                Reference: K. Hattori et al. Antioxidants & Redox Signaling 13 (8) 2010, 1157-1167                     Spectrometers  Shimadzu’s Mass
                This application is based on data obtained as a result of joint research with Dr. Makoto Suematsu, Department of Biochemistry and
                Integrative Medical Biology, School of Medicine, Keio University.


                                                                                                                      13
   8   9   10   11   12   13   14   15   16