
Page 60 - Application Notebook - Solution for Food Safety
P. 60
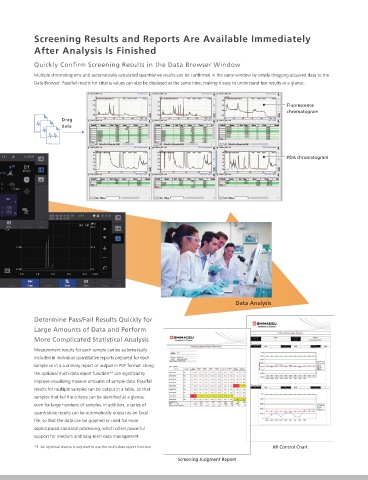
Ready to Use - Measure Samples Immediately After Switching   Screening Results and Reports Are Available Immediately
 the System ON  After Analysis Is Finished


 This system is designed for rapid screening for 10 mycotoxin components in grain products, such as wheat and rice  ours, apples, and milk. Using   Quickly Con rm Screening Results in the Data Browser Window
 the provided kit, which includes a column and CD-ROM, containing optimized pretreatment methods that minimize effects from contaminant
            Multiple chromatograms and automatically calculated quantitative results can be con rmed in the same window by simply dragging acquired data to the
 components and analytical parameters for regulated components, sample measurements can be started immediately.
            Data Browser. Pass/fail results for criteria values can also be displayed at the same time, making it easy to understand test results at a glance.
 In addition to the above screening kit and Nexera-i system, standard samples for the regulated components, pretreatment cartridges, and mobile phases are also required.

                                                                                                Fluorescence
                                                                                                chromatogram
                     Drag
                     data


                                                                                                PDA chromatogram


 Pretreatment


 Analysis and
 Detect EU Criteria   data acquisition
 Concentrations of Mycotoxins with High Sensitivity

 A atoxins Detectable Directly without Fluorescent Derivatization

 By using the i-Series built-in PDA detector with an RF-20Axs  uorescence detector, which offers the highest sensitivity levels in the world, the system can
 detect a atoxins at concentration levels speci ed as criteria values*  in EU directives, without using  uorescent derivatization. The instruction manual
 2
 provided with the system includes pretreatment methods optimized for target samples, which are grains (soft wheat and rice  ours), milk, and apples. The
 troubleshooting section includes key considerations for each process step, from extraction to acquisition, which helps ensure that reliable data can be
 acquired even when analyzing samples for the  rst time.  *2: Excluding foods intended for infants
 Grain (Soft Wheat Flour)  Milk

 Fluorescence   3  ■Peaks  Fluorescence   ■Peaks                               Data Analysis
 detector  1  AFG2  (1 µg/kg)  detector  9  AFM1  (0.05 µg/kg)
 2  AFG1  (1 µg/kg)
 1
 3  AFB2  (1 µg/kg)  9  Determine Pass/Fail Results Quickly for
 4  AFB1  (1 µg/kg)
 5  ZON  (20 µg/kg)
 6  OTA  (2 µg/kg)  Large Amounts of Data and Perform
            More Complicated Statistical Analysis
 6
 4          Measurement results for each sample can be automatically
 2  5
            included in individual quantitative reports prepared for each
 0.0  1.0  2.0  3.0  4.0  5.0  6.0  7.0  8.0  9.0  10.0mm  0.0  1.0  2.0  3.0  4.0  5.0  6.0  7.0 mm  sample or in a summary report or output in PDF format. Using
                                      3
 Grain (Soft Wheat Flour)  Apples  the optional multi-data report function*  can signi cantly
            improve visualizing massive amounts of sample data. Pass/fail
 PDA   ■Peaks  PDA   ■Peaks  results for multiple samples can be output in a table, so that
 detector  7  NIV  (500 µg/kg)  detector  10  PAT  (25 µg/kg)
 8  DON  (500 µg/kg)  samples that fail the criteria can be identi ed at a glance,
 7  8       even for large numbers of samples. In addition, a series of
            quantitative results can be automatically output as an Excel
 10          le, so that the data can be graphed or used for more
            sophisticated statistical processing, which offers powerful
            support for medium and long-term data management.
            *3: An optional license is required to use the multi-data report function.     XR Control Chart
 0.0  1.0  2.0  3.0 mm  0.0  1.0  2.0  3.0 mm
 All added mycotoxin concentrations are converted for foods.  Screening Judgment Report