Page 9 - Application Notebook - Solution for Food Development
P. 9

Application  No.L481
    News

            n Linearity                                            Table 3  Content of Respective Sugars in Energy Drinks
            Fig. 3 shows the calibration curves generated using the                      Content (g/L)
            analytical conditions of Table 2. When generating the                Energy Drink A  Energy Drink B
            curves for the six components over a concentration      Glucose          ND             59
            range of 0.2 to 10 g/L (using the average of three area   Fructose       ND             101
            values, respectively), excellent linearity with a coefficient   Xylitol  25             ND
                                       2
            of determination greater than R =0.9999 was obtained     Sorbitol        14             ND
            for each component.


              Area (×10 ) 4         Area (×10 ) 4
              150                   150
                  m   e s o t l a           e s o c u l g         uRI
                                                                  10
              100                   100                                                        ■ Peaks
                                                                                                 5. xylitol
                                                                                                 6. sorbitol
               50                   50                             8                     5

                       R² = 0.9999981        R² = 0.9999992
               0                     0                             6
                 0     5      10      0      5     10
                     Concentration (mg/L)  Concentration (mg/L)
              Area (×10 ) 4         Area (×10 ) 4
              150                   150                            4                       6
                  fructose              mannitol
              100                   100
                                                                   2
               50                   50
                                                                   0
                       R² = 0.9999976        R² = 0.9999975
               0                     0
                 0     5      10      0      5      10
                     Concentration (mg/L)  Concentration (mg/L)     0       10      20      30      40  min
              Area (×10 ) 4         Area (×10 ) 4
              150                   150
                  xylitol               sorbitol
                                                                  Fig. 4  Chromatogram of Energy Drink A (10 µL Injected)
              100                   100

               50                   50

                       R² = 0.9999982        R² = 0.9999967
               0                     0                            uRI
                 0     5      10      0      5     10                                         ■ Peaks
                     Concentration (mg/L)  Concentration (mg/L)                                 2. glucose
                                                                  30
                                                                                                3. fructose
             Fig. 3  Calibration Curves of a Standard Mixture of Six Sugars
                  (0.2 – 10 g/L, 10 µL Injected)                                3
                                                                  20
                                                                             2
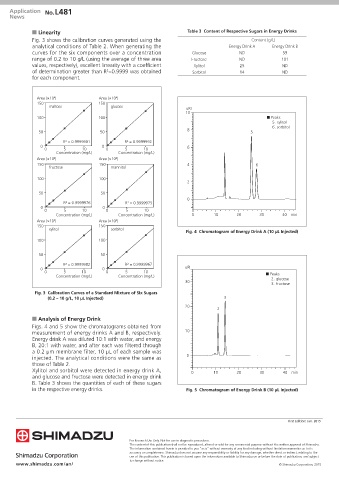
            n Analysis of Energy Drink
            Figs. 4 and 5 show the chromatograms obtained from
            measurement of energy drinks A and B, respectively.   10
            Energy drink A was diluted 10:1 with water, and energy
            B, 20:1 with water, and after each was filtered through
            a 0.2 µm membrane filter, 10 µL of each sample was
            injected. The analytical conditions were the same as   0
            those of Table 2.
            Xylitol and sorbitol were detected in energy drink A,   0       10      20      30      40  min
            and glucose and fructose were detected in energy drink
            B. Table 3 shows the quantities of each of these sugars
            in the respective energy drinks.                      Fig. 5  Chromatogram of Energy Drink B (10 µL Injected)


                                                                                                      First Edition: Jan. 2015


                                               For Research Use Only. Not for use in diagnostic procedures.
                                               The content of this publication shall not be reproduced, altered or sold for any commercial purpose without the written approval of Shimadzu.
                                               The information contained herein is provided to you "as is" without warranty of any kind including without limitation warranties as to its
                                               accuracy or completeness. Shimadzu does not assume any responsibility or liability for any damage, whether direct or indirect, relating to the
                                               use of this publication. This publication is based upon the information available to Shimadzu on or before the date of publication, and subject
                                               to change without notice.
       www.shimadzu.com/an/                                                                        © Shimadzu Corporation, 2015
   4   5   6   7   8   9   10   11   12   13   14