Page 11 - Application Notebook - Solution for Food Development
P. 11

Application  No.L474
    News

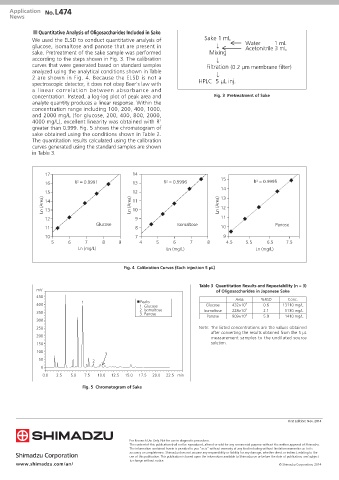
             n Quantitative Analysis of Oligosaccharides Included in Sake
            We used the ELSD to conduct quantitative analysis of         Sake 1 mL     Water         1 mL
            glucose, isomaltose and panose that are present in               ↓         Acetonitrile 3 mL
            sake. Pretreatment of the sake sample was performed            Mixing
            according to the steps shown in Fig. 3. The calibration          ↓
            curves that were generated based on standard samples          Filtration (0.2 µm membrane filter)
            analyzed using the analytical conditions shown in Table          ↓
            2 are shown in Fig. 4. Because the ELSD is not a
            spectroscopic detector, it does not obey Beer's law with   HPLC  5 µL inj.
            a linear correlation between absorbance and
            concentration. Instead, a log-log plot of peak area and         Fig. 3  Pretreatment of Sake
            analyte quantity produces a linear response. Within the
            concentration range including 100, 200, 400, 1000,
            and 2000 mg/L (for glucose, 200, 400, 800, 2000,
                                                         2
            4000 mg/L), excellent linearity was obtained with R
            greater than 0.999. Fig. 5 shows the chromatogram of
            sake obtained using the conditions shown in Table 2.
            The quantitation results calculated using the calibration
            curves generated using the standard samples are shown
            in Table 3.


                 17                             14                             15
                 16        R² = 0.9991          13        R² = 0.9996                     R² = 0.9995
                                                                               14
                 15                             12                             13
                Ln (Area)  14                  Ln (Area)  11                  Ln (Area)  12
                                                10
                 13
                 12                              9                             11
                                   Glucose                     Isomaltose                         Panose
                 11                              8                             10
                 10                              7                             9
                   5     6     7     8     9      4     5     6     7     8     4.5    5.5     6.5    7.5
                            Ln (mg/L)                      Ln (mg/L)                       Ln (mg/L)


                                             Fig. 4  Calibration Curves (Each injection 5 µL)


                                                                       Table 3  Quantitation Results and Repeatability (n = 3)
              mV                                                             of Oligosaccharides in Japanese Sake
              450                                                                   Area     %RSD     Conc.
                              1                  n  Peaks
              400                                 1. Glucose             Glucose   432×10 4   0.6   13110 mg/L
                                                  2. Isomaltose          Isomaltose  228×10 3  2.1   5130 mg/L
              350                                 3. Panose
                                                                          Panose   909×10 2   5.9    1410 mg/L
              300
              250                                                      Note: The listed concentrations are the values obtained
                                                                           after converting the results obtained from the 5 µL
              200
                                                                           measurement samples to the undiluted source
              150                                                          solution.
              100
                                      3
               50                 2
               0
                0.0  2.5  5.0  7.5  10.0  12.5  15.0  17.5  20.0  22.5 min
                              Fig. 5  Chromatogram of Sake


                                                                                                      First Edition: Nov. 2014


                                               For Research Use Only. Not for use in diagnostic procedures.
                                               The content of this publication shall not be reproduced, altered or sold for any commercial purpose without the written approval of Shimadzu.
                                               The information contained herein is provided to you "as is" without warranty of any kind including without limitation warranties as to its
                                               accuracy or completeness. Shimadzu does not assume any responsibility or liability for any damage, whether direct or indirect, relating to the
                                               use of this publication. This publication is based upon the information available to Shimadzu on or before the date of publication, and subject
                                               to change without notice.
       www.shimadzu.com/an/                                                                        © Shimadzu Corporation, 2014
   6   7   8   9   10   11   12   13   14   15   16