
Page 6 - Application Notebook - Solution for Food Development
P. 6
LAAN-A-LC-E244
Application High Performance Liquid Chromatography
News Analysis of Sugars in Orange Juice and Grape Juice
by Prominence-i and Differential Refractive Index
No.L467 Detector
As sugars display little ultraviolet absorption, a Table 1 Analytical Conditions
differential refractive index detector or an evaporative Column : Shim-pack SCR-101N (300 mm L. × 7.9 mm I.D., 10 µm)
light scattering detector is used for their detection. Mobile Phase : Water
The new Prominence-i integrated high-performance Flowrate : 0.6 mL/min
liquid chromatograph can be connected to the RID-10A Column Temp. : 80 °C
Injection Volume : 10 µL
differential refractive index detector. Since the column Detection : RID-10A
oven can accommodate a 30-cm column for use in Polarity +, Cell temp. 40 °C, Response 1.5 sec
sugar analysis (ligand exchange column), and the
temperature can be controlled up to 85 °C, it therefore
supports applications that require a long column and
high column temperature.
Here, we introduce an example of sugar analysis in
juices using the Prominence-i with the RID-10A.
n Analysis of Sugar Standard Solution n Linearity
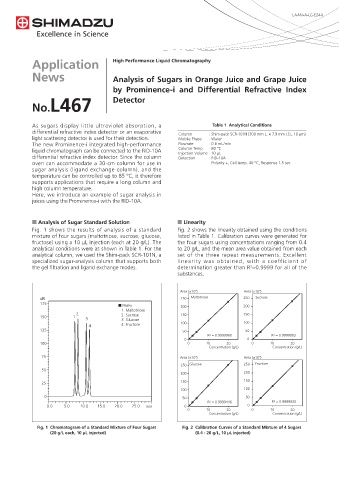
Fig. 1 shows the results of analysis of a standard Fig. 2 shows the linearity obtained using the conditions
mixture of four sugars (maltotriose, sucrose, glucose, listed in Table 1. Calibration curves were generated for
fructose) using a 10 µL injection (each at 20 g/L). The the four sugars using concentrations ranging from 0.4
analytical conditions were as shown in Table 1. For the to 20 g/L, and the mean area value obtained from each
analytical column, we used the Shim-pack SCR-101N, a set of the three repeat measurements. Excellent
specialized sugar-analysis column that supports both linearity was obtained, with a coefficient of
the gel filtration and ligand exchange modes. determination greater than R =0.9999 for all of the
2
substances.
Area (×10 ) 4 Area (×10 ) 4
uRI 250 Maltotriose 250 Sucrose
175 ■ Peaks 200 200
1. Maltotriose
2 2. Sucrose 150 150
150 1 3 3. Glucose
4 4. Fructose 100 100
125 50 50
R² = 0.9999968 R² = 0.9999883
0 0
100 0 10 20 0 10 20
Concentration (g/L) Concentration (g/L)
75 Area (×10 ) 4 Area (×10 ) 4
250 Glucose 250 Fructose
50
200 200
25 150 150
100 100
0 50 50
R² = 0.9999446 R² = 0.9999930
0.0 5.0 10.0 15.0 20.0 25.0 min 0 0
0 10 20 0 10 20
Concentration (g/L) Concentration (g/L)
Fig. 1 Chromatogram of a Standard Mixture of Four Sugars Fig. 2 Calibration Curves of a Standard Mixture of 4 Sugars
(20 g/L each, 10 μL injected) (0.4 - 20 g/L, 10 μL injected)