Page 7 - Application Notebook - Solution for Food Development
P. 7

Application  No.L467
    News

            n Analysis of Orange Juice                               Table 2  Content of Each Sugar in Orange Juices
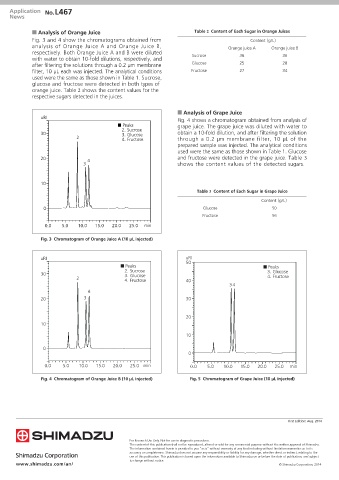
            Fig. 3 and 4 show the chromatograms obtained from                            Content (g/L)
            analysis of Orange Juice A and Orange Juice B,                       Orange juice A  Orange juice B
            respectively. Both Orange Juice A and B were diluted
            with water to obtain 10-fold dilutions, respectively, and   Sucrose      36             36
            after filtering the solutions through a 0.2 µm membrane   Glucose        25             28
            filter, 10 µL each was injected. The analytical conditions   Fructose    27             34
            used were the same as those shown in Table 1. Sucrose,
            glucose and fructose were detected in both types of
            orange juice. Table 2 shows the content values for the
            respective sugars detected in the juices.


                                                               n Analysis of Grape Juice
               uRI
                                                               Fig. 4 shows a chromatogram obtained from analysis of
                                          ■ Peaks              grape juice. The grape juice was diluted with water to
                                            2. Sucrose
               30                           3. Glucose         obtain a 10-fold dilution, and after filtering the solution
                            2               4. Fructose        through a 0.2 µm membrane filter, 10 µL of the
                                                               prepared sample was injected. The analytical conditions
                                                               used were the same as those shown in Table 1. Glucose
               20               4                              and fructose were detected in the grape juice. Table 3
                              3                                shows the content values of the detected sugars.


               10
                                                                      Table 3  Content of Each Sugar in Grape Juice
                                                                                             Content (g/L)
                0                                                       Glucose                  50
                                                                        Fructose                 56
                 0.0   5.0  10.0  15.0  20.0  25.0  min

               Fig. 3  Chromatogram of Orange Juice A (10 μL injected)


               uRI                                                uRI
                                                                  50
                                           ■ Peaks                                            ■ Peaks
                                             2. Sucrose                                        3. Glucose
               30                            3. Glucose
                            2                4. Fructose          40                           4. Fructose
                                                                                  3  4
                                4
               20             3                                   30


                                                                  20
               10

                                                                  10

                0
                                                                   0

                 0.0   5.0   10.0  15.0  20.0  25.0 min             0.0   5.0   10.0  15.0  20.0  25.0  min
               Fig. 4  Chromatogram of Orange Juice B (10 μL injected)  Fig. 5  Chromatogram of Grape Juice (10 μL injected)


                                                                                                      First Edition: Aug. 2014


                                               For Research Use Only. Not for use in diagnostic procedures.
                                               The content of this publication shall not be reproduced, altered or sold for any commercial purpose without the written approval of Shimadzu.
                                               The information contained herein is provided to you "as is" without warranty of any kind including without limitation warranties as to its
                                               accuracy or completeness. Shimadzu does not assume any responsibility or liability for any damage, whether direct or indirect, relating to the
                                               use of this publication. This publication is based upon the information available to Shimadzu on or before the date of publication, and subject
                                               to change without notice.
       www.shimadzu.com/an/                                                                        © Shimadzu Corporation, 2014
   2   3   4   5   6   7   8   9   10   11   12