
Page 55 - Application Notebook - Solution for Food Development
P. 55
LAAN-A-UV-E054
Application Spectrophotometric Analysis
News Differentiating Olive Oils Using UV-VIS
Spectrophotometer and Spectrofluorophotometer
No.A524
Q Introduction
There is growing interest in food safety and organic
foods, with an increasing number of shops specializing
in a variety of food products and increasing circulation
of high price import goods. One of these foods is olive
oil, which is supposed to have both health and
aesthetic benefits. The most expensive form of olive oil
is extra virgin olive oil, which is regulated by the
International Olive Council. Only olive oil that is
chemically unprocessed, produced by squeezing and
filtering olive fruit, and with an acidity of no more than
0.8 % qualifies as extra virgin olive oil. Another olive oil
called pure olive oil is created by purification and high-
temperature treatment. Differentiating between extra
virgin olive oil and pure olive oil based on appearance
alone is difficult. This article describes an attempt to
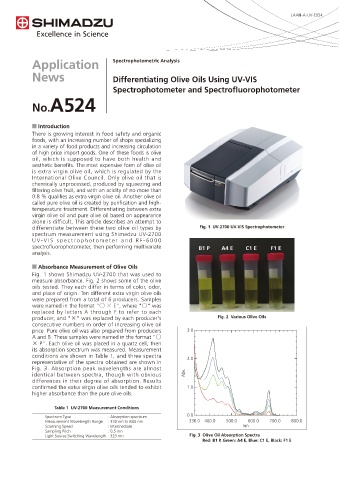
differentiate between these two olive oil types by Fig. 1 UV-2700 UV-VIS Spectrophotometer
spectrum measurement using Shimadzu UV-2700
UV-VIS spectr ophotometer and RF-6000
spectrofluorophotometer, then performing multivariate
B1 P A4 E C1 E F1 E
analysis.
Q Absorbance Measurement of Olive Oils
Fig. 1 shows Shimadzu UV-2700 that was used to
measure absorbance. Fig. 2 shows some of the olive
oils tested. They each differ in terms of color, odor,
and place of origin. Ten different extra virgin olive oils
were prepared from a total of 6 producers. Samples
were named in the format "˓ ʷ E", where "˓" was
replaced by letters A through F to refer to each
producer, and "ʷ" was replaced by each producer's Fig. 2 Various Olive Oils
consecutive numbers in order of increasing olive oil
price. Pure olive oil was also prepared from producers 3.0
A and B. These samples were named in the format "˓
ʷ P". Each olive oil was placed in a quartz cell, then
its absorption spectrum was measured. Measurement
conditions are shown in Table 1, and three spectra 2.0
representative of the spectra obtained are shown in
Fig. 3. Absorption peak wavelengths are almost
identical between spectra, though with obvious Abs.
differences in their degree of absorption. Results
confirmed the extra virgin olive oils tended to exhibit 1.0
higher absorbance than the pure olive oils.
Table 1 UV-2700 Measurement Conditions
0.0
Spectrum Type : Absorption spectrum
Measurement Wavelength Range : 330 nm to 800 nm 330.0 400.0 500.0 600.0 700.0 800.0
Scanning Speed : Intermediate nm
Sampling Pitch : 0.5 nm
Light Source Switching Wavelength : 323 nm Fig. 3 Olive Oil Absorption Spectra
Red: B1 P, Green: A4 E, Blue: C1 E, Black: F1 E