
Page 57 - Application Notebook - Solution for Food Development
P. 57
Application No.A524
News
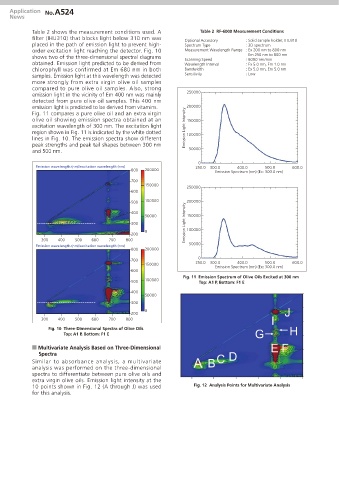
Table 2 shows the measurement conditions used. A Table 2 RF-6000 Measurement Conditions
filter (IHU310) that blocks light below 310 nm was
Optional Accessory : Solid sample holder, IHU310
placed in the path of emission light to prevent high- Spectrum Type : 3D spectrum
order excitation light reaching the detector. Fig. 10 Measurement Wavelength Range : Ex 200 nm to 800 nm
Em 250 nm to 800 nm
shows two of the three-dimensional spectral diagrams Scanning Speed : 6000 nm/min
obtained. Emission light predicted to be derived from Wavelength Interval : Ex 5.0 nm, Em 1.0 nm
chlorophyll was confirmed at Em 680 nm in both Bandwidth : Ex 5.0 nm, Em 5.0 nm
samples. Emission light at this wavelength was detected Sensitivity : Low
more strongly from extra virgin olive oil samples
compared to pure olive oil samples. Also, strong
emission light in the vicinity of Em 400 nm was mainly 250000
detected from pure olive oil samples. This 400 nm
emission light is predicted to be derived from vitamins.
Fig. 11 compares a pure olive oil and an extra virgin
olive oil showing emission spectra obtained at an 150000
excitation wavelength of 300 nm. The excitation light Emission Light Intensity 200000
region shown in Fig. 11 is indicated by the white dotted 100000
lines in Fig. 10. The emission spectra show different
peak strengths and peak tail shapes between 300 nm
and 500 nm. 50000
0
Emission wavelength (nm)/excitation wavelength (nm) 250.0 300.0 400.0 500.0 600.0
800 200000 Emission Spectrum (nm) (Ex: 300.0 nm)
700
150000
250000
600
500 100000
400
50000 150000
300 Emission Light Intensity 200000
0 100000
200
300 400 500 600 700 800
Emission wavelength (nm)/excitation wavelength (nm) 50000
800 200000
0
700
150000 250.0 300.0 400.0 500.0 600.0
Emission Spectrum (nm) (Ex: 300.0 nm)
600
Fig. 11 Emission Spectrum of Olive Oils Excited at 300 nm
500 100000 Top: A1 P, Bottom: F1 E
400
50000
300
0
200
300 400 500 600 700 800
Fig. 10 Three-Dimensional Spectra of Olive Oils
Top: A1 P, Bottom: F1 E
Q Multivariate Analysis Based on Three-Dimensional
Spectra
Similar to absorbance analysis, a multivariate
analysis was performed on the three-dimensional
spectra to differentiate between pure olive oils and
extra virgin olive oils. Emission light intensity at the
10 points shown in Fig. 12 (A through J) was used Fig. 12 Analysis Points for Multivariate Analysis
for this analysis.