
Page 56 - Application Notebook - Solution for Food Development
P. 56
Application No.A524
News
Q Multivariate Analysis Using Absorption Spectra
We attempted to differentiate between pure olive oil
and extra virgin olive oil by performing a multivariate
analysis of the results obtained by absorbance
1)
measurement. The UnscramblerX multivariate analysis
software was used to perform difference analysis on
absorbance at 7 peak wavelengths.
Principal component analysis (PCA) and cluster analysis
were used to differentiate between olive oil types. With
PCA, scores are calculated to allow visual differentiation
by the analyst (score plot). A loading plot is also used to
determine characteristic factors in each grouping that
have a strong influence on the score plot. Cluster
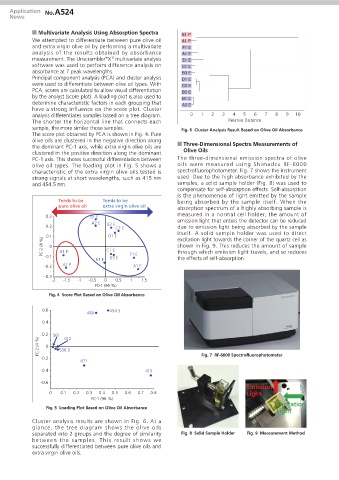
analysis differentiates samples based on a tree diagram. 0 1 2 3 4 5 6 7 8 9 10
The shorter the horizontal line that connects each Relative Distance
sample, the more similar those samples. Fig. 6 Cluster Analysis Result Based on Olive Oil Absorbance
The score plot obtained by PCA is shown in Fig. 4. Pure
olive oils are clustered in the negative direction along
the dominant PC-1 axis, while extra virgin olive oils are Q Three-Dimensional Spectra Measurements of
clustered in the positive direction along the dominant Olive Oils
PC-1 axis. This shows successful differentiation between The three-dimensional emission spectra of olive
olive oil types. The loading plot in Fig. 5 shows a oils were measured using Shimadzu RF-6000
characteristic of the extra virgin olive oils tested is spectrofluorophotometer. Fig. 7 shows the instrument
strong signals at short wavelengths, such as 415 nm used. Due to the high absorbance exhibited by the
and 454.5 nm. samples, a solid sample holder (Fig. 8) was used to
compensate for self-absorption effects. Self-absorption
is the phenomenon of light emitted by the sample
Tends to be Tends to be being absorbed by the sample itself. When the
pure olive oil extra virgin olive oil
absorption spectrum of a highly absorbing sample is
measured in a normal cell holder, the amount of
0.3 B1 E
emission light that enters the detector can be reduced
A2 E B2 E
0.2 C2 E due to emission light being absorbed by the sample
itself. A solid sample holder was used to direct
0.1 D1 E excitation light towards the corner of the quartz cell as
PC-2 (4 %) 0 B1 P C1 E shown in Fig. 9. This reduces the amount of sample
through which emission light travels, and so reduces
-0.1
E1 E B3 E F1 E the effects of self-absorption.
-0.2 A1 P A1 E
-0.3
-2 -1.5 -1 -0.5 0 0.5 1 1.5
PC-1 (96 %)
Fig. 4 Score Plot Based on Olive Oil Absorbance
0.6 454.5
480
0.4
0.2 561 612
PC-2 (4 %) 0 536.5
-0.2 Fig. 7 RF-6000 Spectrofluorophotometer
671
-0.4 415
-0.6
Emission
0 0.1 0.2 0.3 0.4 0.5 0.6 0.7 0.8
Light
PC-1 (96 %)
Fig. 5 Loading Plot Based on Olive Oil Absorbance Excitation
Light
Cluster analysis results are shown in Fig. 6. At a
glance, the tree diagram shows the olive oils
separated into 2 groups and the degree of similarity Fig. 8 Solid Sample Holder Fig. 9 Measurement Method
between the samples. This result shows we
successfully differentiated between pure olive oils and
extra virgin olive oils.